Electoral Insight - Participation In The Electoral Process
Electoral Insight – January 2001
Electoral Facts
Wayne Brown, Elections Canada
Participation in a general election or referendum involves electors, candidates, political parties and election officers. The numbers below, many of which have grown dramatically during Canada’s history, illustrate the magnitude of that participation.
Number of electors
There were 361 000 electors at Canada's first general election in 1867, compared to approximately 20 million at recent general elections. Meanwhile, the country's population has grown from 3.2 million at Confederation to over 30 million today.
Percentage of electors in population
The names of only about 11 percent of the population were on the lists of electors in 1867. At general elections in recent decades, the number has averaged almost 70 percent. The increase in those with the right to vote is largely due to the removal of property qualifications, the extension of the right to vote to women in 1918, and the lowering of the voting age in 1970.
Voter turnout

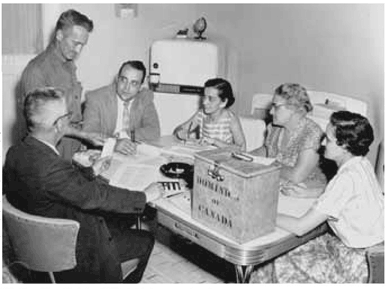
This polling station used in the June 1957 federal election appears to have been
located in a kitchen. Since the 1980s, greater recognition of the need for level
access
has led to locating most polling places in community centres and schools.
An average of 71 percent of registered electors cast ballots at the 40 federal general elections and referendums held from Confederation to 2000. Post-war turnout from 1945 through the 1980s averaged about 75 percent, without major fluctuations from event to event. More recently, the participation rates among registered electors have fallen to 67 percent in 1997 and to a slightly lower level again in 2000.
Highest voter turnout
The highest percentage of electors to cast ballots at a federal election was 79.4 percent in March 1958, when the Progressive Conservative Government of John Diefenbaker went from minority to majority status in the House of Commons. Next in line came the succeeding general elections of 1962 and 1963, during a minority government period, when the voter turnout was 79.0 and 79.2 percent respectively.
Lowest voter turnout
The percentage of electors who cast ballots at the 2000 federal general election was slightly below the level of 62.9 percent in June 1896, when Sir Wilfrid Laurier was elected Liberal Prime Minister.
Young electors
At the 1997 general election, electors aged 25 years or less were 11 percent less likely to vote than those in older age groups. (From the 1997 Canadian Election Study.)
By-election turnout
Voter participation in federal by-elections is almost always lower than in general elections. During the 1980s, the average by-election turnout was approximately 60 percent, while in the 1990s it declined to about 44 percent.
Referendum turnout
The voter turnout at the two most recent federal referendums was quite similar. In October 1992, 71.8 percent of electors cast ballots on a proposal to amend the Constitution, while 71.3 percent voted at the April 1942 referendum on a question related to military conscription. At Canada's only other national referendum, which sought Canadians' views about liquor sale prohibition in September 1898, the voter turnout was 44.6 percent.
Other countries
How does Canada's voter turnout compare to those in some other countries? In the United States, less than 52 percent of the voting age population cast ballots in the 2000 presidential election, and 36 percent did so for legislative elections in 1998. Russia's presidential election turnout in March 2000 was 69 percent. Among countries with compulsory voting, the participation at their most recent elections was 96 percent in Australia, 91 percent in Belgium and 79 percent in Brazil. (International Foundation for Election Systems (IFES), U.S. Federal Election Commission.)
Number of political parties
From Confederation until the 1920s, only two parties (Liberals and Conservatives), and sometimes a small number of independent candidates, usually contested federal elections in Canada. This changed when regional groups, such as the Progressives and the United Farmers, ran candidates, followed by such parties as the Social Credit and the Co-operative Commonwealth Federation (which later became the New Democratic Party). Since 1970, political parties have had the choice, under the Canada Elections Act, to register with the Chief Electoral Officer.
Most political parties
The highest ever number of registered political parties to contest a Canadian election was 14, in 1993. There were 12 in 1988, 10 in 1997 and 11 in 2000.
Most candidates
The 1993 election also had a record number of candidates – 2 155. The increase of almost 600 from the previous election was partly the result of the record number of parties in 1993. There were 1 672 candidates in 1997 and 1 808 in 2000.
Female candidates
At the 1993 federal general election, more women than ever before ran for a seat in the House of Commons. There were 475, about 22 percent of all the candidates in that election. There were 408 female candidates in the 1997 election, 24.4 percent of the total number. In 2000, 375 women candidates made up 21 percent of the total.
Women elected
The largest number of women elected to the House of Commons was 62, in 1997 and again in 2000, which represents about 21 percent of the total membership of the Commons. The largest number of women previously elected was 53, in 1993.
Election personnel
When a general election or referendum is held, Elections Canada employs about 150 000 people in the 301 electoral districts across the country. This number includes returning officers, deputy returning officers, poll clerks, special ballot coordinators, registration officers and the Elections Canada staff in Ottawa.
Note:
The opinions expressed are those of the authors; they do not necessarily reflect those of the Chief Electoral Officer of Canada.
