 Site Menu
Public Opinion Survey Following the November 25, 2013 By-elections
Section 2: Awareness and Registration
This section focuses on electors' experiences prior to voting during the period beginning with the announcement of the by-elections (October 20, 2013) up to the by-election itself (November 25, 2013). This includes electors' awareness of the by-election in their riding, their awareness of voting procedures and requirements, their interaction (if applicable) with Elections Canada, and their registration in the by-election, including their receipt of a voter information card.
Generally, more than nine-in-ten respondents (93%) were aware that the by-elections were taking place. Traditional media (television, 44%; newspapers, 38%; and radio, 30%) were the sources of information about the by-election cited the most by respondents. Most respondents obtained specific information on voting procedures from their voter information cards (59%). Relatively few respondents (36%) indicated they noticed an advertisement from Elections Canada over the course of the by-election.
2.1 Awareness of the By-election
Overall awareness of the November 25, 2013 by-elections was high, with 93 percent of respondents indicating they were aware of the by-elections. In particular, nearly all electors in Brandon–Souris, MB were aware of the by-election (see Figure 2.1 below).
Figure 2.1: Awareness about By-elections

Text version of "Figure 2.1: Awareness about By-elections"
Awareness of the by-elections was high across all age brackets, with at least nine-tenths of electors in each bracket being aware of the by-elections.
2.1.1 Sources for Information about the By-elections
The top five sources of information about the by-elections cited by respondents were television, newspapers, radio, parties or candidates' election signs, and the voter information card. While some media were cited at a consistent rate across ridings, particularly the VIC and word of mouth, there was significant variation in the percentage of the electorate citing television, newspaper, and radio (see Figure 2.2 below). For instance, electors in BrandonSouris were most likely to cite newspaper or radio but least likely to cite television.
| From which sources do you recall hearing about the by-election? | Bourassa (n=368) |
Brandon–Souris (n=400) |
Provencher (n=387) |
Toronto Centre (n=367) |
Overall (n=1522) |
|---|---|---|---|---|---|
| Television | 50% | 14% | 32% | 53% | 44% |
| Newspaper | 24% | 48% | 38% | 39% | 38% |
| Radio | 18% | 47% | 34% | 21% | 30% |
| Candidates/parties election signs | 16% | 13% | 26% | 20% | 19% |
| Voter information card (received in the mail) | 14% | 12% | 18% | 19% | 16% |
| Word of mouth (friends, relatives, colleagues) | 11% | 15% | 16% | 13% | 14% |
| EC householder–brochure/leaflet/reminder card (received in the mail) | 24% | 4% | 11% | 13% | 13% |
| Internet: other websites | 3% | 7% | 8% | 10% | 7% |
| Directly from candidates/parties | 6% | 9% | 6% | 6% | 7% |
| Brochures/pamphlets from candidates/parties | 2% | 1% | 2% | 1% | 2% |
| Social media | 1% | 1% | 4% | 1% | 2% |
| Billboards | 0% | 0% | 0% | 3% | 1% |
| Posters/Bulletin Boards | 1% | 0% | 1% | 0% | <1% |
| Elections Canada (phone call, enumerator) | 0% | 0% | 0% | 1% | <1% |
| Don't know/Refusal | 1% | 2% | 2% | 3% | 2% |
Notes: Columns may not add up to 100% as respondents were permitted to provide as many as three replies. The ordering of reasons in the table is based on the overall trend.
Base: Electors who were aware of the by-elections.
Some sources of information were also statistically related to particular socio-demographic groups:
- Television, newspapers, and radio correlated positively with age, with fewer youth (32% TV; 30% newspaper; 21% radio) having learned of the by-elections from these sources compared to middle-aged (44% TV; 34% newspaper; 34% radio) and older electors (52% TV; 47% newspaper; 33% radio). Radio was also less commonly cited by students (8%) and unemployed electors (18%) than by employed (34%) and retired (31%) electors.
- Older electors were significantly less likely to cite the voter information card (11%, compared to 17% of youth and 19% of middle-aged electors). Only four percent of students cited the VIC, a rate significantly lower than that observed for employed electors (19%) and retirees (12%). Electors in higher-income households were also more likely to cite the VIC (21%) compared to those in lower-income households (12%).
- Women were also found to be more likely to cite the VIC (19% vs. 12% for men), as well as reminder brochures from Elections Canada, referred to in this report as "EC Householders" (16% vs. 10% for men);
- Word of mouth was more likely to be cited by unemployed electors (21%) compared to employed electors (12%), and women (16%) compared to men (11%).
2.2 Advertising by Elections Canada
Overall, about one-third of respondents (36%) indicated they had noticed an advertisement from Elections Canada, with some variation between ridings (see Figure 2.3 below). Electors in Brandon–Souris, MB in particular, were more likely to have noticed Elections Canada advertisements.
Figure 2.3: Awareness of Elections Canada Advertising

Text version of "Figure 2.3: Awareness of Elections Canada Advertising"
Base: Electors who were aware of the by-elections.
There was also significant variation among certain socio-demographic groups:
- Male electors (40%) were more likely than female electors (32%) to have seen Elections Canada advertisements;
- Older electors (41%) were more likely than youth (29%) to have noticed advertisements; and
- Voters (41%) were more likely to have noticed ads compared to non-voters (27%).
2.2.1 Placement of Advertising
Traditional media were the primary sources where respondents noticed advertisements, with newspapers being the most cited source (47%), followed by radio and television (22% for each). It should be noted however that Elections Canada does not advertise on television during by-elections, and thus this rate account recall error on respondents' part, potentially attributing advertising by political parties and candidates to Elections Canada or simply misremembering where they saw the advertisement. This finding was particularly pronounced in Bourassa and Toronto Centre (see Figure 2.4). Respondents in these two ridings were also significantly more likely to have cited an Elections Canada householder brochure. A higher number of respondents in Bourassa cited signs, posters, pamphlets, or brochures around their area compared to other ridings.
| Where did you notice [the Elections Canada advertisement]? | Bourassa (n=134) |
Brandon–Souris (n=177) |
Provencher (n=125) |
Toronto Centre (n=110) |
Overall (n=546) |
|---|---|---|---|---|---|
| Newspaper | 22% | 65% | 48% | 46% | 47% |
| Radio | 23% | 29% | 23% | 9% | 22% |
| Television | 31% | 14% | 19% | 26% | 22% |
| EC householder – brochure/leaflet/reminder card (received in the mail) | 18% | 3% | 4% | 18% | 10% |
| Signs/posters around the area | 18% | 4% | 9% | 10% | 10% |
| Voter information card (received in the mail) | 8% | 5% | 5% | 9% | 6% |
| Pamphlets/brochures | 10% | 5% | 6% | 3% | 6% |
| Elections Canada Website | 1% | 3% | 6% | 4% | 4% |
| Local Elections Canada office in the electoral district | 0% | 1% | 0% | 1% | <1% |
| Don't know/Refusal | 1% | 4% | 7% | 3% | 4% |
Notes: Columns may not add up to 100% as respondents were permitted to provide as many as three replies. The ordering of reasons in the table is based on the overall trend.
Base: Electors who noticed an Elections Canada advertisement.
There was also significant variation in the sources cited by socio-demographic groups:
- Youth (34%) and middle-aged electors (27%) were more likely to have heard the advertisements on the radio than were older electors (10%). Older electors, on the other hand, were the most likely to cite newspapers (58% compared to 42% and 34% for middle-aged and youth electors respectively);
- Men were much more likely to have heard the advertisements on the radio (28%) than were women (15%). Women on the other hand were more likely than men to have seen an ad in a pamphlet, brochure (9% vs. 4%) or sign or poster (14% vs. 7%);
- Respondents from lower-income households (23%) were more likely than those in middle-income (7%) and higher-income households (1%) to cite an Elections Canada householder brochure; and were less likely to cite radio (11% compared to 32% and 25% for middle and higher-income household respondents respectively) and newspaper (36% vs. 49% and 56%);
- Employed electors (29%) were more likely than unemployed electors (8%) and retired electors (11%) to cite radio; and
- Voters were much more likely than non-voters to cite newspapers (voters, 52% to non-voters, 33%), whereas non-voting electors were significantly more likely to have seen an advertisement on a sign or poster (non-voters, 18% to voters, 7%).
2.2.2 Recall of Advertising Content
Respondents' most commonly recalled topic from advertising was the date of the by-elections, cited by 31% of those who noticed an advertisement. This was followed closely by "reminder to vote" (25%), the requirement that voters must prove their ID and address (12%), and "enticement to vote" (10%) (see Figure 2.5 below). It is important to note that six percent of respondents who saw Elections Canada advertising believed it to contain information specific to candidates or parties, indicating either confusion regarding the question or conflation between political and Elections Canada ads. This was observed primarily in Bourassa.
| What did the Elections Canada advertisement talk about? | Bourassa (n=134) |
Brandon–Souris (n=177) |
Provencher (n=125) |
Toronto Centre (n=110) |
Overall (n=546) |
|---|---|---|---|---|---|
| Election date | 28% | 37% | 28% | 28% | 31% |
| Reminder to vote | 27% | 32% | 19% | 17% | 25% |
| Voters must prove their ID address before voting | 8% | 11% | 15% | 16% | 12% |
| Enticement to vote | 21% | 9% | 6% | 4% | 10% |
| Advanced polling dates | 10% | 7% | 6% | 7% | 8% |
| Where to go to vote | 3% | 8% | 13% | 5% | 7% |
| Polling stations' opening hours | 8% | 11% | 4% | 5% | 7% |
| Any specific information on candidates/parties | 10% | 5% | 3% | 5% | 6% |
| Telephone number for Elections Canada | 0% | 3% | 5% | 7% | 3% |
| Voting at the local Elections Canada office | 2% | 3% | 6% | 1% | 3% |
| Special Voting Rules | 3% | 3% | 2% | 3% | 3% |
| Reminder that a VIC will come in the mail | 0% | 1% | 6% | 0% | 2% |
| The upcoming by-election, what it is | 4% | 0% | 1% | 0% | 1% |
| How to vote | 2% | 1% | 2% | 1% | 1% |
| Website (elections.ca) | 0% | 0% | 1% | 3% | 1% |
| Voting by mail | 0% | 1% | 1% | 0% | <1% |
| Other (reviewed) | 0% | 0% | 1% | 0% | <1% |
| Don't know/Refusal | 24% | 24% | 30% | 39% | 28% |
Notes: Columns may not add up to 100% as respondents were permitted to provide as many as three replies.
Base: Electors who noticed an Elections Canada advertisement.
A number of trends were found regarding advertising, namely that:
- Higher-income respondents were the most likely to recall mention of the election date (50% compared to 25% for middle-income respondents and 17% for lower-income respondents). Those from higher-income households were also significantly more likely than those from lower-income households to recall reminders to vote (34% to 22%), as well as mention of the identification requirements (16% to 7%);
- Lower-income respondents (10%) were more likely than higher-income respondents (1%) to recall that the advertisements contained specific information on candidates or parties, a finding that indicates possible confusion between Elections Canada advertisements and those used by specific parties or candidates;
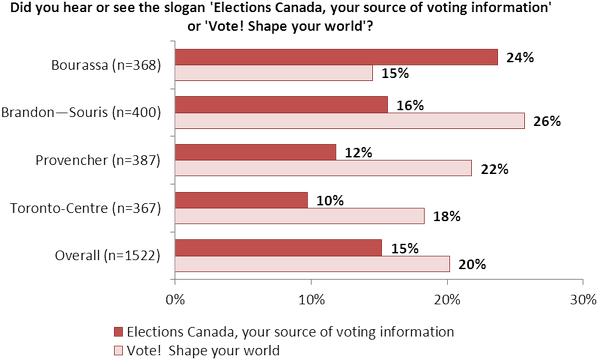
2.2.3 Slogan Recall and Preference
During by-elections, Elections Canada has used various slogans to engage the electorate, including: "Elections Canada, your source of voting information" (herein the "information slogan")Footnote 2, and "Vote! Shape your world" (herein the "shape-your-world slogan")Footnote 3. Overall, exposure to both was low, with only one-in-five (20%) electors indicating they saw or heard the information slogan over the course of the by-election, and slightly fewer indicating they saw or heard the shape-your-world slogan (15%). Exposure was concentrated within certain locations and demographics. Respondents in Brandon–Souris and Provencher were more likely to recall the information slogan than respondents in Bourassa. Alternatively, respondents in Bourassa were both more likely to recall the shape-your-world slogan than respondents in other ridings (see Figure 2.6 below). Respondents in Toronto Centre were also significantly more likely to say they did not recall the shape-your-world slogan compared to other ridings.
Exposure to each slogan was associated with some socio-demographic groups: The shape-your-world slogan was more commonly recalled by youth (23% compared to 12% for other age groups), students (41%, compared to 16% of employed electors, 10% of those who were unemployed and 9% of retired electors), and electors from low-to-middle-income households (low, 23%, and middle, 15% compared to high, 9%).
Despite the lower visibility of the shape-your-world slogan, it was clearly the preferred of the two, with 51 percent of respondents choosing it compared to 35 percent choosing the information slogan.Footnote 4 This preference was particularly pronounced in Bourassa and Toronto Centre, while preferences in the other two ridings were more evenly split (see Figure 2.7 below).
Figure 2.6: Slogan Recall
Text version of "Figure 2.6: Slogan Recall"
Base: Electors aware of the by-elections.
Figure 2.7: Slogan Preference

Text version of "Figure 2.7: Slogan Preference"
Base: Electors aware of the by-elections.
Respondents preference for one slogan over the other was associated with socio-demographic factors. Elections Canada, your source of voting information was significantly preferred by middle-income respondents (44%) compared to both lower- and higher-income respondents (32% for both); and by older respondents (39%) compared to youth (32%). The shape-your-world slogan, alternately, was preferred significantly by female respondents (55% vs. 46% by men).
2.3 Awareness of Voting Procedures and Requirements
Most electors (59% of those aware of the by-election) received information on voting procedures (e.g., when and where to vote, how to vote, how to prove your identity, etc.) from their voter information card. The VIC was the most important source across all four ridings, though use of other sources for this information did differ significantly from one riding to the next (see Figure 2.8 below). Of particular note were trends in Bourassa, where nearly one-quarter of electors cited an EC householder, a rate about three-times higher than that in the other three ridings. Electors in Bourassa were also most likely to report learning about voting procedures from television.
| Where did you get information on voting procedures for this by-election? | Bourassa (n=368) |
Brandon–Souris (n=400) |
Provencher (n=387) |
Toronto Centre (n=367) |
Overall (n=1522) |
|---|---|---|---|---|---|
| Voter information card | 54% | 59% | 62% | 60% | 59% |
| EC householder – brochure/leaflet/reminder card (received in the mail) | 23% | 7% | 8% | 6% | 11% |
| Newspapers | 9% | 15% | 9% | 4% | 10% |
| Friends/family/parents | 6% | 8% | 8% | 5% | 7% |
| Television | 13% | 4% | 5% | 4% | 6% |
| Radio | 5% | 9% | 7% | 1% | 6% |
| Political parties/candidates | 3% | 1% | 2% | 6% | 3% |
| Local Elections Canada office in the electoral district | 1% | 3% | 3% | 2% | 2% |
| Internet/Website (other than elections.ca) | 2% | 3% | 3% | 1% | 2% |
| Pamphlets/brochures (unspecified source) | 2% | 2% | 1% | 2% | 2% |
| Elections Canada website | 3% | 0% | 2% | 1% | 1% |
| Elections Canada telephone (1 800 number) | 2% | 1% | 1% | 1% | 1% |
| Posters/bulletin boards | 1% | <1% | 1% | 1% | 1% |
| Revising agents/enumerators | <1% | 1% | 1% | <1% | <1% |
| Social media | 0% | <1% | 1% | 0% | <1% |
| Other | 0% | 0% | <1% | 0% | <1% |
| None/Did not intend to vote | 5% | 8% | 7% | 17% | 9% |
| Don't know/Refusal | 5% | 7% | 7% | 7% | 6% |
Note: Columns may not add up to 100% as respondents were permitted as many as three replies.
Base: Electors who were aware of the by-elections.
Sources of information for voting procedures also related significantly with socio-demographic trends:
- Youth were significantly more likely than other age groups to cite family, friends or parents (15% compared to 4% for other age groups), and were also significantly more likely than older electors to not seek any source for voting procedure information (11% vs. 6%). Middle-aged electors were more likely to cite their VIC (67% compared to 60% for older electors and 50% for youth). Older electors were more likely to cite the EC householder (15% compared to 11% of middle-aged electors and 7% of youth), newspapers (17% vs. 7% and 3%, respectively), and television (10% vs. 4% and 3%, respectively);5
- Household income also related to certain sources, with two-thirds of those from middle- or higher-income households citing the VIC (67% for both), compared to slightly under half of lower-income households (47%); and
- Voters were significantly more likely than non-voters to obtain information from their VIC (65% to 47%), and newspapers (11% to 6%).
2.3.1 Awareness of ID Requirements
Among voting procedures and requirements, the survey focussed particularly on proof of identity requirements. Most electors knew that voters must present proof of identity in order to vote at a federal election (95%), and nearly as many also knew proof of address was required (87%). Awareness of both requirements was significantly lower in the two Manitoba ridings compared to the two urban ridings (see Figure 2.9 below). This trend was most pronounced for awareness of proof of address.
Figure 2.9: Awareness of ID Requirements to Vote at a Federal Election

Text version of "Figure 2.9: Awareness of ID Requirements to Vote at a Federal Election"
Awareness of each requirement did not differ significanlty between socio-demographic groups. Voters were somewhat more aware of both requirements than non-voters (97% to 92% for proof of identity; 90% to 84% for proof of address).
Electors learned of proof of identity and address requirements from a variety of sources, though generally speaking this knowledge was largely "known prior to" rather than learned during the by-election period. The most common five sources were, in order of frequency:
- Experience / prior knowledge (31%);
- Voter information card received in the mail (30%);
- Previous election (i.e., the 2011 general election) (20%);
- Word of mouth from friends, relatives, colleagues, and others (12%); and,
- At the polling station (i.e., "When I voted") (12%).
Sources varied only modestly between ridings, with electors in Bourassa more likely to have learned of these requirements from an EC householder, and less likely from their voter information card, compared to the three other ridings (see Figure 2.10 below). This is counter-intuitive as electors in Bourassa were more likely than electors elsewhere to report having received a voter information card.
| From what source(s) do you recall hearing about these requirements? | Bourassa (n=397) |
Brandon–Souris (n=384) |
Provencher (n=392) |
Toronto Centre (n=399) |
Overall (n=1573) |
|---|---|---|---|---|---|
| Experience/prior knowledge | 31% | 31% | 30% | 33% | 31% |
| Voter information card (received in the mail) | 22% | 34% | 29% | 35% | 30% |
| Previous election | 20% | 15% | 18% | 25% | 20% |
| Word of mouth (friends, relatives, colleagues) | 11% | 12% | 15% | 11% | 12% |
| When I voted | 11% | 12% | 15% | 11% | 12% |
| Newspaper | 5% | 9% | 6% | 5% | 6% |
| TV | 8% | 5% | 6% | 5% | 6% |
| EC householder - brochure/ leaflet/ reminder card (received in the mail) | 11% | 2% | 2% | 4% | 5% |
| Radio | 4% | 5% | 5% | 2% | 4% |
| Candidates/parties | 2% | 1% | 2% | 3% | 2% |
| Internet: other websites | 1% | 1% | 1% | 1% | 1% |
| Elections Canada Website | 1% | 1% | < 1% | 1% | 1% |
| Social media (Facebook, Twitter, etc.) | < 1% | 2% | < 1% | 0% | <1% |
| Other | < 1% | < 1% | 0% | < 1% | <1% |
| Don't know/Refusal | 4% | 6% | 7% | 2% | 5% |
Note: Columns may not add up to 100% as respondents were permitted as many as three replies.
Some sources were statistically related to particular socio-demographic groups. Sources of awareness which significantly correlated with a particular socio-demographic group included:
- Voter information cards were more likely a source among voters (35% compared to 22% of non-voters);
- Word of mouth was more likely a source among youth (23%) compared to electors 35 or older (8%);
- Newspaper was more likely to be cited by women (9%) than by men (4%);
- Television was more likely to be cited by older electors (7%) than by youth (3%); and
- EC householders, though only cited by about five percent of all electors, were almost exclusively cited by electors 35 or older (5% for middle-aged; 7% for older compared to 1% of youth). It was also more commonly cited by electors from lower-income households (8%) compared to electors from higher-income households (3%).
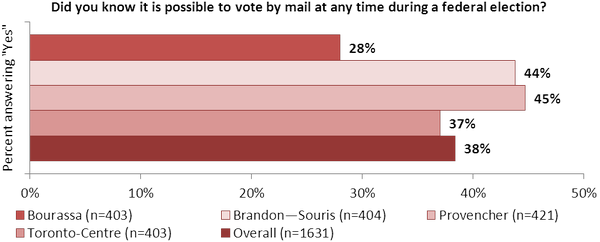
2.3.2 Awareness of Voting Options
It is possible to vote by mail at any time during a federal election–including by-elections–but less than one percent of all voting respondents took advantage of this method. This may have been in part due to low awareness, as a majority of electors in all four ridings were unaware of this option (see Figure 2.11 below). Awareness was especially low in Bourassa, where more than two-thirds (69%) of electors did not know of this option. Voters were significantly more aware of this option than non-voters (46% to 28%). Women were less likely to be aware (35% vs. 42% of men), and awareness improved with age (18 to 34, 32%; 35 to 54, 38%; 55 and up, 44%).
Figure 2.11: Awareness of Voting Options
Text version of "Figure 2.11: Awareness of Voting Options"
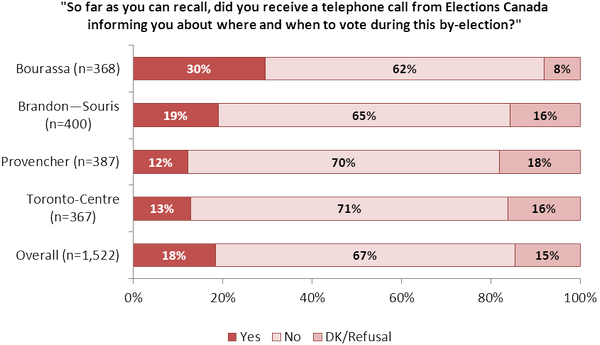
2.4 Interaction with Elections Canada
Most electors who were aware of the by-elections (78%) had had no contact with Elections Canada during the campaign (other than when at the polling station on election day). Although Elections Canada does not call electors on the telephone to inform them about where or when to vote during elections, 18 percent of electors (who were aware of the by-elections) indicated that they had received such a call. Respondents in Bourassa were substantially more likely to have indicated that they received a call from Elections Canada than other ridings, with three-in-ten respondents saying they had received a call, significantly more than other ridings (see Figure 2.12 below).
Figure 2.12: Contact by Elections Canada
Text version of "Figure 2.12: Contact by Elections Canada"
Base: Electors aware of the by-elections.
There were a few socio-demographic variances of significance for this question, namely:
- Lower-income (24%) and middle-income (19%) respondents were significantly more likely to say they had received a call compared to higher-income respondents (12%);
- Youth respondents were more likely to say they did not receive a call (74%) compared to older electors (63%); and
- Employed respondents were more likely to say that they did not receive a call (70%) compared to other employment statuses (62%).
Overall, there was no significant difference in turnout among those who reported receiving a call (62%) compared to those who did not (60%). In Brandon–Souris, electors who reported receiving a call were less likely to have voted (54%) compared to those who did not report receiving a call (68%). In Toronto Centre an opposite trend was observed, with those who reported receiving a call being more likely to have voted (83%) compared to those who did not (62%). The findings for both Brandon–Souris and Toronto Centre were deemed statistically significant.
Only five percent of electors reported that they attempted to contact Elections Canada themselves. However, those who did were significantly more likely to have voted than those who did not. Most electors who called Elections Canada reported having received all the information they needed (78%), as opposed to partial information (15%) or none (7%). Due to the low number of electors who attempted to contact Elections Canada (5% of all aware, n=82), comparisons between ridings and socio-demographic groups were not deemed statistically significant.
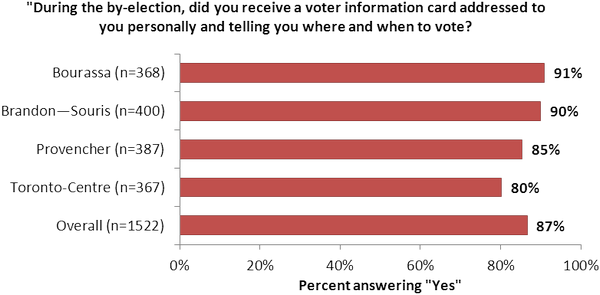
2.5 Voter Information Card and Voter Registration
Most electors reported that they had received a VIC prior to the by-election day (87%). Electors in Bourassa and Brandon–Souris were the most likely to recall receiving a VIC, and those in Toronto Centre the least likely (see Figure 2.13 below). Electors who voted were more likely to recall receiving a VIC (93%) compared to those who did not (77%).
Figure 2.13: Recall of Voter Information Card
Text version of "Figure 2.13: Recall of Voter Information Card"
Base: All electors aware of by-election.
Recall rates of the VIC were higher among middle-aged (92%) and older electors (93%) compared to youth (73%); and among those who were retired (93%) or employed (82%) compared to unemployed electors (76%) and students (68%). It was additionally found that women were more likely to recall receiving a VIC than men (89% to 84%). VIC receipt did not differ significantly between electors with different types of dwellings (e.g., houses compared to apartments).
2.5.1 Accuracy of the Voter Information Card
Nearly all VICs received contained electors' correct addresses (97%) and names (96%). Accuracy did not differ significantly between ridings or socio-demographic groups.
2.5.2 Recall of Voter Information Card Content
Most electors only recalled that the VIC contained information on when and where to vote (59%), but sizeable portions of electors also recalled information about advance polls (17%), their polling station number (13%), or identification requirements (10%). Interestingly, about three percent of respondents recalled specific information about candidates and parties (although such information is not included on VIC).
2.5.3 Steps Taken by Electors Who Did Not Receive a Voter Information Card
If an elector did not receive a voter information card, they often did nothing to verify whether they were registered to vote (62% of electors who did not receive a VIC). Of those who did take action, they most commonly found out about their voter registration status at a local polling station or Elections Canada office (67%) or called the number indicated on another's VIC (12%). Electors in Provencher were most likely to take some specific action, while those in Bourassa were least likely to take action. Ultimately the key determinant of whether an elector took action to ensure they were registered to vote was voting behaviour itself. Among voters who did not receive a VIC, four-fifths (80%) took a specific action to ensure they were registered. Among non-voters however, less than one-fifth (14%) took action. There were no relevant trends related to socio-demographic variables.
Return to source of Footnote 2 In French, the information slogan is "Elections Canada, votre source d'information sur le vote."
Return to source of Footnote 3 In French, the shape slogan is "Voter c'est choisir son monde."
Return to source of Footnote 4 14 percent of electors expressed no preference among the two slogans.
Return to source of Footnote 5 Some age-relationships appear to intersect strongly with employment-relationships. For instance, one-quarter of students cited family, friends, or parents, compared to only seven percent among employed electors. Retirees similarly displayed trends that were on par with or greater than those observed for older electors.