Survey of Electors Following the 41st General Election
Fairness and Trust
In line with the strategic objectives laid out in Elections Canada's 2008‑2013 Strategic Plan, the 2011 survey added new indicators about the perceived fairness of the election and trust in election results.
Most View Conduct of Election as Fair
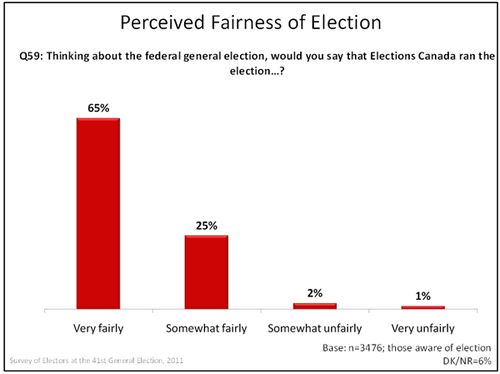
The perception that the general election was conducted by Elections Canada in a fair manner was widespread. Fully 90% of respondents felt that Elections Canada ran the election in a fair manner, with nearly two-thirds (65%) saying very fairly. Only 3% felt that the election was not conducted fairly, while 6% were unsure or did not venture an opinion.
Aboriginals and youth were slightly less likely than the general population to say that Elections Canada ran the election fairly (84/88% vs. 90%), due largely to their lesser propensity to say that Elections Canada did so very fairly (49/52% vs. 65%). Aboriginals were also more likely to specify that Elections Canada was unfair in its administration of the election (9% vs. 4%).

Text description of "Perceived Fairness of Election" graph
Sociodemographic differences
The likelihood of thinking that Elections Canada ran the election fairly was higher amongst:
- Electors without a disability (91% vs. 82% with a disability).
- Electors with household incomes over $40,000 (92‑93% vs. 86% with household incomes of $40,000 or less).
- Electors who are interested in politics (92% vs. 82% who are not).
- Electors who followed the campaign closely (93% vs. 83% who did not).
- Those who said they voted (93% vs. 74% of those who said they did not vote).
There was a positive relationship between thinking that Elections Canada ran the election fairly and satisfaction with service by Elections Canada. Ninety-four percent of those who thought Elections Canada ran the campaign at least somewhat fairly were very satisfied with service, compared with 86% who were somewhat satisfied, 72% who were not very satisfied, and 54% who were not at all satisfied.
High Levels of Trust in Election Results
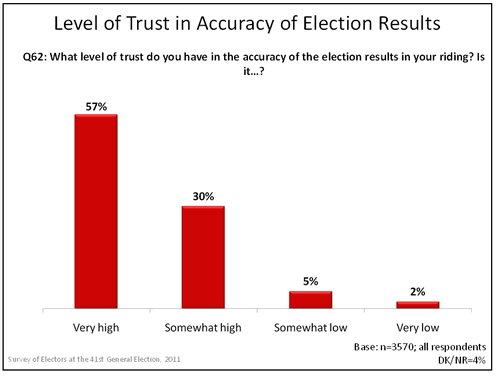
The large majority (87%) expressed high levels of trust in the accuracy of election results in their riding, with most (57%) saying their trust levels are very high. Relatively few said their trust is somewhat or very low.
The likelihood of trusting the accuracy of election results was lower among Aboriginals (66%) and youth (82%) than the general population (87%). Both groups were particularly less likely to have high levels of trust, with roughly a third (34%) of Aboriginals and 43% of youth saying so, compared with the majority (57%) of the general population.
Text description of "Level of Trust in Accuracy of Election Results" graph
Sociodemographic differences
The likelihood of trusting the accuracy of election results in their riding was higher amongst:
- Electors with education above high school (90‑94% vs. 78% with high school or less).
- Electors who are employed (90%), followed by students (89% vs. 80‑84% of others).
- Anglophones (90% vs. 81% of Francophones).
- Aboriginals living off a reserve (73% vs. 58% living on a reserve).
- Electors who are interested in politics (92% vs. 72% who are not interested).
- Electors who followed the campaign closely (93% vs. 73% who did not).
- Those who said they voted (92% vs. 67% who said they did not vote).
Trust in the accuracy of the election results is positively related with household income. Seventy-eight percent of electors with household incomes of less than $40,000 said their trust in the results was at least somewhat high compared with 89% of those with household incomes between $40,000 and $60,000, 93% of those with household incomes between $60,000 and $100,000, and 95% of those with household incomes of $100,000 or more.
