 Site Menu
Facilitating First Nation Voter Participation for the 42nd Federal General Election
3. Findings and Results
3.1 Outreach
3.1.1 AFN Call Centre
Number of First Nations Called
Of the 1,122 calls made by AFN staff through the call centre, 485 of the 497 First Nations prioritized for outreach were called (or 98%). This meant that 100% (or 43 out of 43) of the priority FEDs were called.
Of the 485 First Nations called, AFN staff made contact with 430 (or 87%) of the priority First Nation communities identified for outreach.
Results of Calls
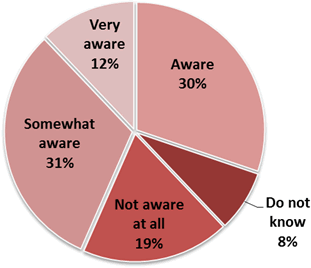
Of the 430 First Nations the AFN staff contacted, 42% were "very aware" or "aware" of the ID requirements to vote in the upcoming federal election. Approximately 31% were "somewhat aware," while 19% of First Nations were "not aware at all." Approximately 8% of callers "did not know." (See Figure 3.1.)
Figure 3.1: How aware were callers of the ID requirements? (n = 430)
Text Description of "How aware were callers of the ID requirements?"Text Description
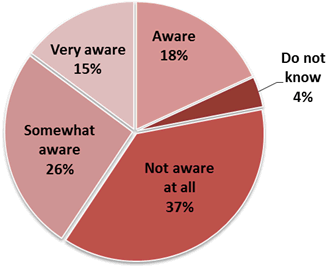
When asked about the Letter of Confirmation of Residence, 33% of First Nations were "very aware" or "aware" of the ID requirements to vote in the upcoming federal election. Approximately 26% were "somewhat aware," while 37% of callers were "not aware at all." Approximately 4% of callers "did not know." (See Figure 3.2.)
Figure 3.2: How aware were callers of the Letter of Confirmation of Residence? (n = 430)
Text Description of "How aware were callers of the Letter of Confirmation of Residence?"Text Description
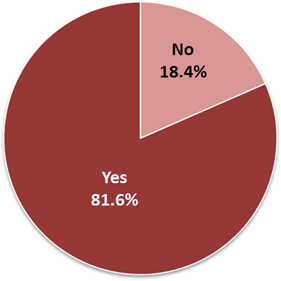
When asked whether the First Nation wanted a template Letter of Confirmation of Residence sent to them (usually by e-mail and sometimes by fax) in order to print individual letters, 82% responded "yes," whereas 18% responded "no." (See Figure 3.3.)
Figure 3.3: Did they want a template Letter of Confirmation of Residence? (n = 430)
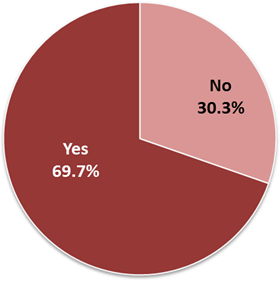
When asked whether the First Nation also wanted another version of the Letter of Confirmation of Residence so that they could use their Band membership list and merge it with the template letter to create a batch of letters, 70% responded "yes," and 30% responded "no." (See Figure 3.4.)
Figure 3.4: Did they want details on how to use mail merge? (n = 430)
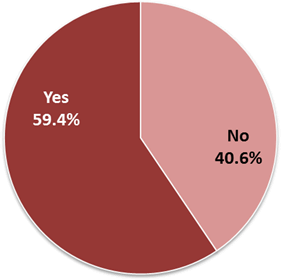
When First Nations were offered additional information on topics related to the federal GE, 59% answered "yes," and 41% answered "no." (See Figure 3.5.)
Figure 3.5: Were they interested in additional information? (n = 430)
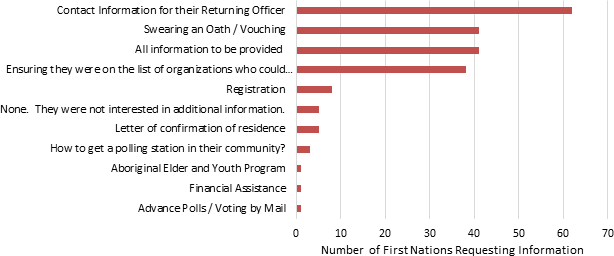
When First Nations responded "yes" to receiving additional information, they were offered topics such as how to get in touch with an RO; details on swearing an oath; determining whether they were on a list of organizations that could provide the Letter of Confirmation of Residence, details on registration and how to ask for a polling station in the community; whether there were any job opportunities (AEYP); and details on advance polls. Over 40% responded that they wanted all the information available sent to them, while approximately 5% were not interested in receiving any additional information. (See Figure 3.6.)
Figure 3.6: What kind of additional information were they interested in?
Text Description of "What kind of additional information were they interested in?"Text Description
In every case where an e-mail was sent to a First Nation as part of call centre activities, it would include the name of the RO for their FED as well as a toll-free number and information on how to reach the RO.
Flow of Calls
The following outlines the flow of calls made by AFN staff through the call centre. Note that often, multiple calls were required to reach the appropriate person at a respective Band office.
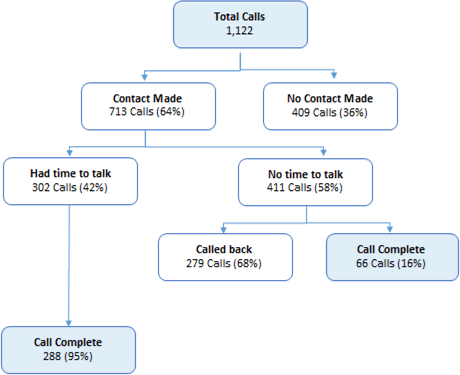
Overall, 18 AFN staff were involved in the call centre and made 1,122 calls to 485 First Nations.
Of the 1,122 calls made by AFN staff, contact was made with an individual by phone 713 times (or 64% of the time). Of approximately 36% of the calls (or 409), no contact was made with an individual (i.e., phone message, wrong number, no answer). (See Figure 3.7.)
Figure 3.7: Flow chart of call centre calls
Text Description of "Flow chart of call centre calls"Text Description
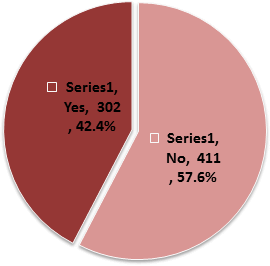
For the 713 calls where contact was made over the phone, more than 42% (or 302) of callers had time to talk to AFN staff. Nearly 58% (or 411) callers did not have time to talk. (See Figure 3.8.)
Figure 3.8: Did the person have time to talk?
For the 411 callers that did not have time to talk, AFN staff were able to e-mail information to someone at the First Nation and "complete the call" for 66 (or 16%) of the callers. For 279 (or 68%) of the callers, AFN staff talked to someone, but required a follow-up call to connect with the appropriate person at the First Nation in charge of election activities. (See Table 3.1.)
For the 302 callers that had time to talk, AFN staff were able to convey all the information and "complete the call" for 288 (or 95%) of the callers. Approximately 9 (or 3%) of the remaining callers required further follow-up.
| Call | Yes | No |
|---|---|---|
| Call complete | 95% | 16% |
| I got the right person, more conversation needed. | 3% | 8% |
| No one answered. I need to call back. | 0% | 7% |
| Someone answered, didn't talk to the right person. I need to call back. | 1% | 68% |
| Other | 1% | 1% |
3.1.2 Distribution of Elections Canada Products
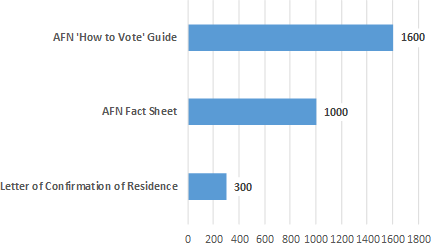
In addition to broad communication efforts, the AFN distributed EC products through AFN in-person outreach activities. Products were selected based on messaging priorities and feedback from First Nation electors. (See Figure 3.9.)
Figure 3.9: Elections Canada products distributed
Text Description of "Elections Canada products distributed"Text Description
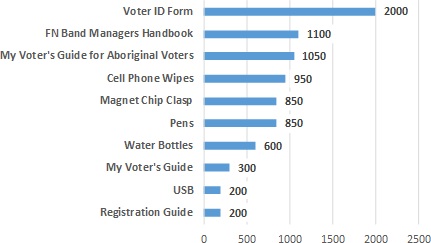
In addition to EC materials, the AFN developed and distributed a number of products through outreach activities. (See Figure 3.10.)
Figure 3.10: Products distributed through outreach activities
Text Description of "Products distributed through outreach activities"Text Description
3.1.3 Online Surveys
Before the election, the AFN sent an open online survey to its First Nation communities and partners to distribute. Overall, 78 participants answered this pre-election survey.
Following the election, the AFN sent out an online survey to First Nation communities and partners to distribute. Overall, 306 participants answered this post-election survey. Footnote 17
Questions around voting participation, voting experiences, challenges and barriers to voting – for the 2015 and previous federal elections – were included. The data are provided for information, and results should be interpreted with caution, recognizing that the survey sample was small, participants self-selected and the number of participants in the pre- and post-election surveys varied significantly. Additionally, participants' ability to recall their experience in previous federal elections was likely limited by the amount of time that had elapsed.
Voting Participation
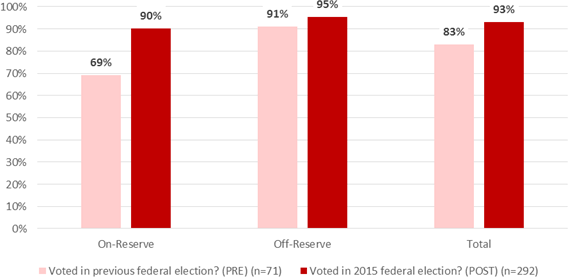
Figure 3.11 shows the comparison between voting participation before the 42nd GE and following the 42nd GE for First Nation electors living on and off reserve. Approximately 83% of First Nation electors indicated that they had voted in a previous GE, compared to 93% who identified that they voted in the 2015 42nd GE. This change in voter participation was especially realized for First Nation citizens living on reserve, increasing from 69% to 90%. Surveys are known to over-report voter turnout due to a combination of factors, including social desirability and selection bias.
Of those that voted in the 42nd GE, 65% of First Nation electors who live on reserve voted in their First Nation community, while 8% of First Nation electors who live off reserve voted in their First Nation community.
Figure 3.11: Voting participation by First Nation citizens (self-reported responses from online surveys)
Text Description of "Voting participation by First Nation citizens (self-reported responses from online surveys)"Text Description
For First Nation survey participants who indicated that they had voted in the 42nd GE, 74% identified that they had travelled 10 minutes or less by car to vote, compared to 67% of survey participants who had voted in previous federal elections. Approximately 19% of 2015 voters had travelled 10 to 30 minutes to vote, compared to 25% of voters in previous elections, while 7% of 2015 voters had travelled longer than 30 minutes to vote, compared to 8% in previous elections. The decrease in distance travelled was most evident for First Nation voters living off reserve. (See Figure 3.12.)
Figure 3.12: Distance to voting
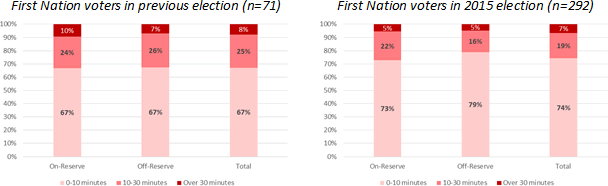
Text Description of "Distance to voting"Text Description
Identification
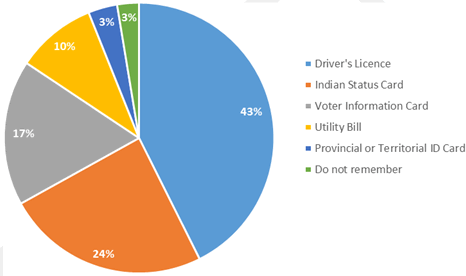
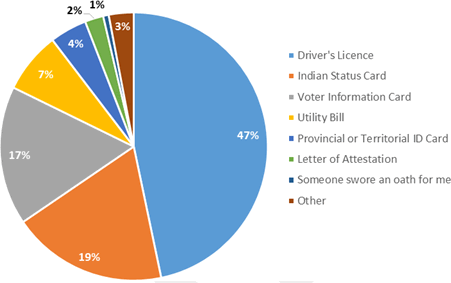
First Nation voters were asked what type of identification they had used when voting. Figures 3.13 and 3.14 show a comparison of the types of identification used by First Nation voters in previous elections and in the 42nd GE. Note that participants could select more than one piece of identification from the list.
The identification used in previous elections was similar to that used by First Nation voters in the 42nd GE. A driver's licence was used by most individuals (43% in previous elections and 47% in 2015), followed by an Indian Status Card (24% and 19%), VIC (17% and 17%), Footnote 18 utility bill (10% and 7%) and provincial or territorial ID card (3% and 4%).
During the 42nd GE, 2% of respondents indicated using a Letter of Confirmation of Residence, signed by their First Nation, as a form of identification. Approximately 1% had someone swear an oath for them, while 3% used "other" forms of identification, such as a bank statement, firearms licence, pay stub or social assessment stub.
Figure 3.13: Type of identification used when voting
First Nation voters in previous elections (n = 72)
Text Description of "Type of identification used when voting"Text Description
Figure 3.14: Type of identification used when voting
First Nation voters in 2015 election (n = 292)
Text Description of "Type of identification used when voting"Text Description
Voting Experiences
First Nation voters were asked to describe their experience while voting during federal elections. The AFN online survey looked at voter experiences in both the 42nd GE and in past federal elections as a basis for comparison.
Experience is subjective, and many factors can play a role in determining a positive, negative or neutral outcome. For the AFN online survey, knowledge of various aspects of the voting process was considered a useful indicator when determining voting experience for First Nation electors. As noted, there are many other factors that can impact experience, but given that the primary role of EC and the project was to provide electors with information, knowledge was the chosen indicator.
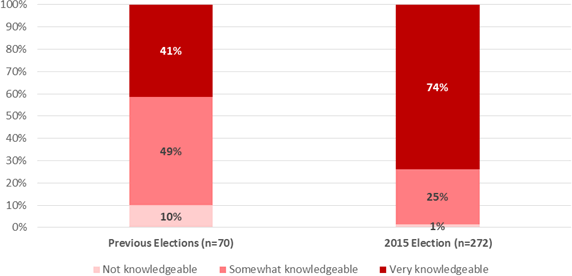
The AFN online survey asked First Nation voters to rate their knowledge of where and when to vote (Figure 3.15) on a scale ranging from not knowledgeable to somewhat knowledgeable to very knowledgeable.
The survey found that, in previous federal elections, 41% of respondents considered themselves very knowledgeable, while 10% rated themselves as not knowledgeable. For the 42nd GE, 74% of respondents viewed themselves as very knowledgeable, while only 1% considered themselves to be not knowledgeable.
Figure 3.15: Knowledge of where and when to vote
Text Description of "Knowledge of where and when to vote"Text Description
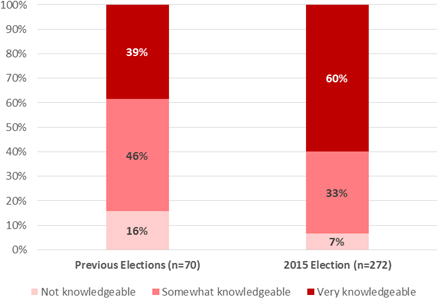
Respondents were asked to rate their knowledge of the different ways they could vote in past federal elections and the 42nd GE (Figure 3.16).
In previous federal elections, a total of 85% of respondents expressed that they had been at least somewhat knowledgeable, while 39% had been very knowledgeable. For the 42nd GE, 93% of respondents considered themselves to be at least somewhat knowledgeable, while nearly 60% considered themselves to be very knowledgeable.
When comparing previous election results to the 42nd GE, the gap in those respondents who considered themselves not at all knowledgeable about the different ways they could vote in federal elections drops 9 points, from 16% to 7%.
Figure 3.16: Knowledge of different ways you can vote
Text Description of "Knowledge of different ways you can vote"Text Description
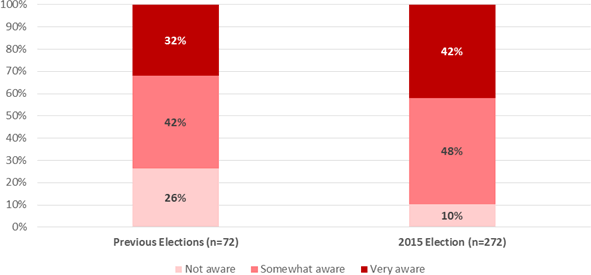
Figure 3.17 outlines respondents' knowledge of EC voter information campaigns during previous federal elections and compares this to the 42nd GE.
In previous elections, 74% of respondents stated that they had been either somewhat or very aware of EC voter information campaigns. During the 42nd GE, this number climbs to 90% of respondents, with a 10% increase in those who considered themselves very aware of EC information campaigns.
Figure 3.17: Knowledge of Elections Canada information campaigns
Text Description of "Knowledge of Elections Canada information campaigns"Text Description
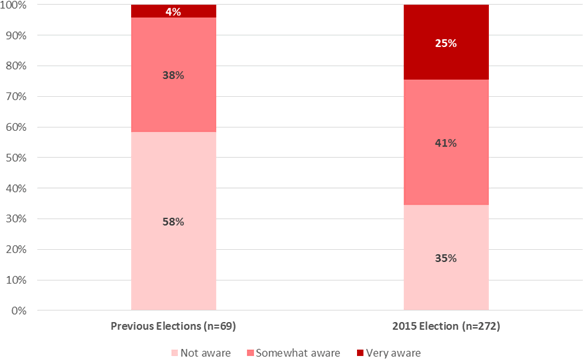
In addition to rating knowledge of EC voter information campaigns, the AFN survey asked respondents to rate their knowledge of AFN voter information campaigns in both previous federal elections and during the 42nd GE.
Figure 3.18 shows that 58% of respondents had been "not aware" of AFN voter information campaigns during previous federal elections. This number decreases 23 points to 35% for the 42nd GE. Conversely, only 4% of respondents had been "very aware" of AFN voter information campaigns in previous federal elections, while 25% were "very aware" during the 42nd GE.
Figure 3.18: Knowledge of AFN voter information campaigns
Text Description of "Knowledge of AFN voter information campaigns"Text Description
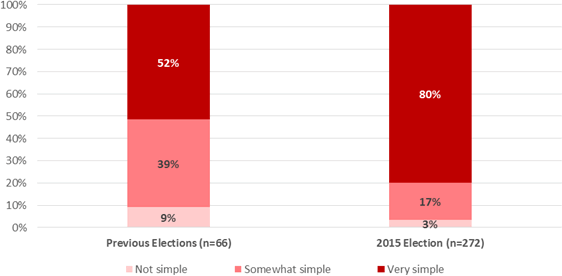
The final determinant of voter experience used by the AFN online survey was simplicity of voting. Respondents were asked to rate how simple the voting process was during both previous federal elections and the 42nd GE.
In previous federal elections, 91% of respondents reported that they had found the process either "somewhat simple" or "very simple." In the 42nd GE, this number increased to 97% of respondents (which may reflect changes in the process, more effective communication or both). The number of respondents who had found the process "somewhat simple" in previous elections decreased from 39% to 17% for the 42nd GE, while those who had found voting to be "very simple" increased from 52% to 80%. (See Figure 3.19.)
Figure 3.19: How simple was the voting process?
Text Description of "How simple was the voting process?"Text Description
Barriers to Voting
The final area measured by the AFN online survey was barriers to voting for First Nation electors.
Respondents were asked to select from a list of barriers that had applied. This question was asked for both previous federal elections and the 42nd GE.
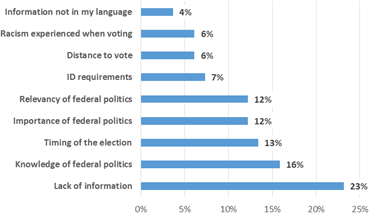
Figure 3.20 shows that, in previous federal elections, the most common barrier according to respondents was a lack of information (23%), followed by knowledge of federal politics (16%) and the timing of the election (13%). The relevancy and importance of federal elections for First Nation electors was selected as a barrier by 24% of respondents. A further 7% highlighted ID requirements as a barrier to voting.
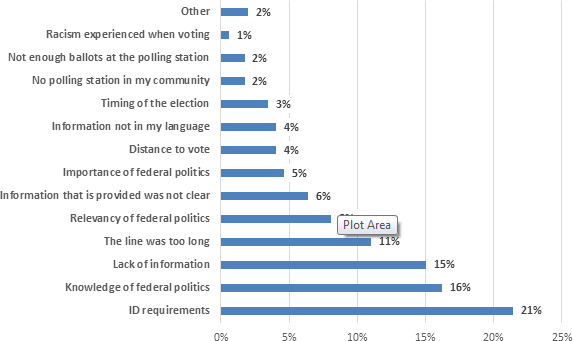
Figure 3.21 looks at barriers to voting during the 42nd GE. Of these, 21% of respondents selected ID requirements as a barrier, a 14 percentage point increase from previous elections. Knowledge of federal politics was again selected by 16% of respondents as a barrier to voting, while a lack of information was chosen by 15%, which is down 8 percentage points when compared to previous elections.
Figure 3.20: Challenges experienced when voting in previous elections (n = 70)
Text Description of "Challenges experienced when voting in previous elections"Text Description
Figure 3.21: Challenges experienced when voting in the 2015 election (n = 272)
Text Description of "Challenges experienced when voting in the 2015 election"Text Description
Return to source of Footnote 17 When accounting only for First Nation electors, n = 71 for the pre-election survey, and n = 292 for the post-election survey.
Return to source of Footnote 18 In post-election surveys, electors sometimes report that they brought their VIC "as identification." The VIC was not accepted as identification or proof of residence in the 2015 election, but electors were encouraged to bring it.