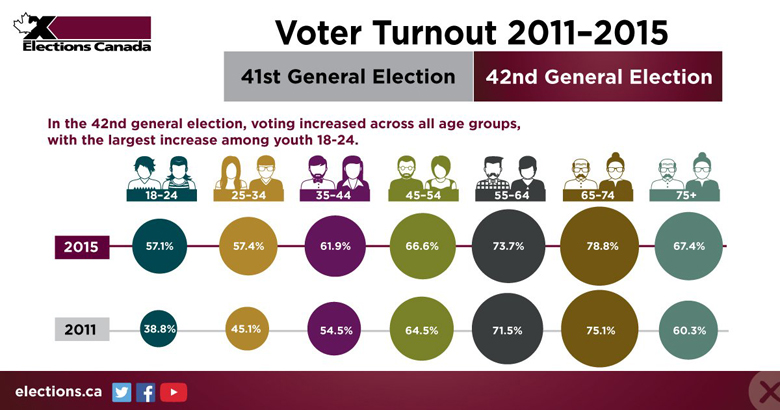
Infographic on Voter Turnout in the 41st and 42nd General Elections, by Age Group
Textual description
In the 42nd general election, voting increased across all age groups, with the largest increase among youth 18 to 24.
The infographic provides the following statistics:
- Among 18- to 24-year-olds, voter turnout increased from 38.8% in 2011 to 57.1% in 2015.
- Among 25- to 34-year-olds, voter turnout increased from 45.1% in 2011 to 57.4% in 2015.
- Among 35- to 44-year-olds, voter turnout increased from 54.5% in 2011 to 61.9% in 2015.
- Among 45- to 54-year-olds, voter turnout increased from 64.5% in 2011 to 66.6% in 2015.
- Among 55- to 64- year-olds, voter turnout increased from 71.5% in 2011 to 73.7% in 2015.
- Among 65- to 74-year-olds, voter turnout increased from 75.1% in 2011 to 78.8% in 2015.
- Among 75-year-olds and over, voter turnout increased from 60.3% in 2011 to 67.4% in 2015.

