 Site Menu
Survey of Election Officers Following the 42nd Federal General Election
4. Satisfaction with Election Materials
This section presents findings related to the overall satisfaction of election officers regarding the election materials, list of electors, and bingo sheets that were provided to them.
Election Materials
Overall, eighty-nine percent (TOP2: 89%) of officers reported being satisfied with the election materials that were provided to them, which is a single point decrease from 2011 results (90%). Regionally, officers from Ontario (TOP2: 91%) and Atlantic Provinces (TOP2: 90%) were more likely to report being satisfied, while officers from Alberta (TOP2: 81%) and British Columbia (TOP2: 86%) were significantly less likely to report being satisfied. Compared with 2011, satisfaction with election materials has slightly decreased in all provinces, except in Ontario, where it has increased by a single point of percentage.
Chart 4 : Satisfaction with election materialsFootnote 6
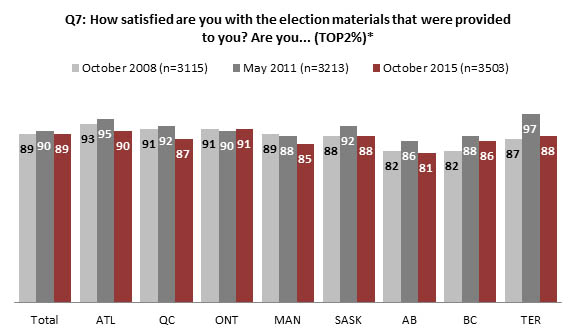
Text Description of "Chart 4 : Satisfaction with election materials"
* TOP2 (Very satisfied + fairly satisfied)
Officers working in ordinary polls were significantly more likely to report satisfaction with the election materials (TOP2: 90%) than those working in advance polls (TOP2: 83%). Meanwhile, those working in advance polls (BTM2: 17%) were significantly more likely to report being not satisfied than those who worked at the ordinary polls and mobile polls (BTM2: 10%, each)
Both deputy returning officers and information officers were significantly more likely to report being satisfied (TOP2: 90% each) than central poll supervisors (TOP2: 83%).
| Q7: How satisfied are you with the election materials that were provided to you? Are you... | Type of Poll | Staffing Position | ||||||||
|---|---|---|---|---|---|---|---|---|---|---|
|
Adv.
(n=232) |
Ord. (n=2997) | Adv. + ord. (n=224) | Mobile (n=49)* |
DRO
(n=1261) |
IO
(n=421) |
CPS (n=245) | RegO (n=315) | PC (n=1261) | Overall (n=3503) | |
| % | ||||||||||
| TOP2 | 83 | 90 | 86 | 89 | 90 | 90 | 83- | 87 | 89 | 89 |
| BTM2 | 17 | 10 | 14 | 10 | 10 | 9 | 17 | 13 | 11 | 11 |
| Very satisfied | 45 | 53+ | 41 | 39 | 54 | 52 | 41- | 48 | 52 | 52 |
| Fairly satisfied | 38 | 36 | 45 | 50+ | 36 | 38 | 42+ | 39 | 37 | 37 |
| Not very satisfied | 12 | 9 | 12 | 8 | 9 | 7 | 16+ | 11 | 9 | 9 |
| Not at all satisfied | 5+ | 1 | 3 | 2 | 2 | 2 | 2 | 2 | 2 | 2 |
| DK/Refused | 0 | 0 | 0 | 2 | 0 | 1 | 0 | 0 | 0 | 0 |
* Caution should be used when interpreting results due to small sample.
Election officers indicated several reasons for not being satisfied with the election materials. Over a quarter (26%) of those who reported they were either "not very satisfied" or "not at all satisfied" with the election materials (n=383) specified that they were particularly not satisfied with the guidebook. That said, "Documentation was too complicated/confusing" (worded as "materials were not clear/hard to understand" in 2015) experienced a seventeen percentage point decrease from 2011 (24%) to 2015 (7%).
| Q8: Could you tell us which materials you were not satisfied with? [max 3 mentions] | Overall (n=383) |
|---|---|
| % | |
| Guidebook | 26 |
| Flowchart | 14 |
| Insufficient or poor trainingFootnote 8 | 12 |
| Generally dissatisfied with materials | 10 |
| Insufficient amount of materials / no materials (unspecified) | 10 |
| Too much material (i.e., excess/left over) | 9 |
| Signs | 8 |
| Materials were not clear / hard to understand (unspecified) | 7 |
| Pencils, rulers, tape or other utensils were poor quality or missing | 7 |
There were variances across regions to note in comparison to the overall population:
- Officers in the Atlantic Provinces were significantly more likely to report that they were not satisfied with the guidebook (47%) and forms (7%, as compared with 3% overall).
- Officers in Quebec were significantly more likely (18%) to report that there was too much material left over.
- Officers in Quebec were also more likely to report that pencils, rulers, tape or other utensils were poor quality or missing (18%).
- Officers in Saskatchewan were significantly more likely (21%) to report overall dissatisfaction with materials.
There were also differences when looking at the reasons for dissatisfaction by staffing position:
| Deputy Returning Officers |
|
| Information Officers |
|
| Central Poll Supervisors |
|
| Registration Officers |
|
| Poll Clerks |
|
Overall, almost all election officers (TOP2: 95%) reported that the guidebook was useful. Across regions, election officers in Manitoba and Saskatchewan were more likely to find it useful (TOP2: 96% each), while those in Alberta were less likely to share this opinion (TOP2: 89%).
| Q9: Would you say that the guidebook was...? | Region | ||||||||
|---|---|---|---|---|---|---|---|---|---|
| ATL (n=346) | QC (n=924) | ON (n=1385) | MAN (n=154) | SASK (n=115) | AB (n=39)* | BC (n=423) | TER (n=115) | Overall (n=3503) | |
| % | |||||||||
| TOP2 | 95 | 94 | 95 | 96 | 96 | 89 | 94 | 91 | 95 |
| BTM2 | 5 | 6 | 4 | 5 | 2 | 10 | 5 | 5 | 5 |
| Very useful | 64+ | 55 | 61 | 67+ | 56 | 49- | 55 | 55 | 59 |
| Somewhat useful | 31- | 39 | 34 | 28- | 41 | 40+ | 40 | 35 | 36 |
| Not very useful | 4 | 5 | 3 | 2 | 2 | 8 | 5 | 2 | 4 |
| Not at all useful | 1 | 2 | 1 | 3 | 0 | 2 | 0 | 3 | 1 |
| DK/Refused | 1 | 0 | 1 | 0 | 1 | 1 | 1 | 5 | 1 |
* Caution should be used when interpreting results due to small sample.
The usefulness of the guidebook across polling stations is similar, with minimal differences between stations. Officers who worked at a polling station on an Aboriginal reserve were significantly more likely to report the guidebook as "very useful" (68%) compared with all other polling stations.
| Q9: Would you say that the guidebook was...? | Polling Station | ||||
|---|---|---|---|---|---|
| Abo. Reserve (n=282) | Sen. / LT Care (n=797) | Stud. Res. (n=466) | Other (n=1958) | Overall (n=3503) | |
| % | |||||
| TOP2 | 96 | 96 | 96 | 95 | 95 |
| BTM2 | 3 | 4 | 4 | 5 | 5 |
| Very useful | 68+ | 59 | 58 | 59 | 59 |
| Somewhat useful | 28- | 37 | 38 | 36 | 36 |
| Not very useful | 2 | 3 | 3 | 4 | 4 |
| Not at all useful | 1 | 1 | 1 | 1 | 1 |
| DK/Refused | 0 | 0 | 0 | 1 | 1 |
Regardless of the type of poll, usefulness of guidebooks was rated highly; officers who worked at the advance polls (64%) were significantly more likely to report the guidebook as "very useful" than those who worked both advance and ordinary polls (52%) and mobile polls (50%). Deputy returning officers (63%) were significantly more likely to report the guidebook as "very useful" compared with information officers (51%). Information officers were the least likely to have found the guidebook useful (TOP2: 93%).
| Q9: Would you say that the guidebook was...? | Type of Poll | Staffing Position | ||||||||
|---|---|---|---|---|---|---|---|---|---|---|
|
Adv.
(n=232) |
Ord. (n=2997) | Adv. + ord. (n=224) | Mobile (n=49)* |
DRO
(n=1261) |
IO
(n=421) |
CPS (n=245) | RegO (n=315) | PC (n=1261) | Overall (n=3503) | |
| % | ||||||||||
| TOP2 | 92 | 95 | 96 | 92 | 95 | 93 | 95 | 94 | 94 | 95 |
| BTM2 | 7 | 5 | 4 | 7 | 4 | 5 | 5 | 5 | 5 | 5 |
| Very useful | 64+ | 59 | 52 | 50- | 63+ | 51- | 55 | 59 | 59 | 59 |
| Somewhat useful | 29- | 36 | 45 | 42 | 33 | 42+ | 40 | 36 | 36 | 36 |
| Not very useful | 5 | 4 | 4 | 7 | 4 | 4 | 3 | 3 | 4 | 4 |
| Not at all useful | 2 | 1 | 0 | 1 | 1 | 2 | 2 | 2 | 1 | 1 |
| DK/Refused | 1 | 1 | 0 | 0 | 0 | 2 | 1 | 1 | 0 | 1 |
* Caution should be used when interpreting results due to small sample.
Eighty-five percent (TOP2: 85%) of election officers reported that the forms provided were very or somewhat easy to complete. By region, officers in Ontario (TOP2: 88%), Saskatchewan (TOP2: 87%), Quebec (TOP2: 86%), and the Atlantic Provinces (TOP2: 86%) were significantly more likely to find the various forms easy to complete compared with officers in British Columbia and Alberta (TOP2: 78% and 76% respectively). Further, officers in Ontario (48%) and Manitoba (53%) were significantly more likely to report that the various forms were "very easy" to complete.
| Q12: Would you say that the various forms that were provided to you were (response) to complete? | Region | ||||||||
|---|---|---|---|---|---|---|---|---|---|
| ATL (n=346) | QC (n=924) | ON (n=1385) | MAN (n=154) | SASK (n=115) | AB (n=39)* | BC (n=423) | TER (n=115) | Overall (n=3503) | |
| % | |||||||||
| TOP2 | 86 | 86 | 88 | 85 | 87 | 76 | 78 | 78 | 85 |
| BTM2 | 13 | 13 | 11 | 12 | 10 | 21 | 22 | 22 | 13 |
| Very easy | 42 | 37 | 48+ | 53+ | 34- | 39 | 42 | 39 | 43 |
| Somewhat easy | 44 | 49+ | 40 | 32- | 54+ | 37- | 36- | 39 | 42 |
| Somewhat difficult | 13 | 11 | 10 | 9 | 7 | 18 | 20 | 19 | 12 |
| Very difficult | 1 | 2 | 1 | 3 | 4 | 3 | 1 | 3 | 2 |
| DK/Refused | 1 | 1 | 1 | 3 | 3 | 4 | 1 | 0 | 1 |
* Caution should be used when interpreting results due to small sample.
Election officers who worked at a polling station on an Aboriginal reserve, at a student residence, and at a regular polling station were significantly more likely to find the various forms easy to use compared with those who worked at a seniors' residence poll (TOP2: 85%, 85% and 86% respectively, compared with 78%).
| Q12: Would you say that the various forms that were provided to you were (response) to complete? | Polling Station | ||||
|---|---|---|---|---|---|
| Abo. Reserve (n=282) | Sen. / LT Care (n=797) | Stud. Res. (n=466) | Other (n=1958) | Overall (n=3503) | |
| % | |||||
| TOP2 | 85 | 78 | 85 | 86 | 85 |
| BTM2 | 14 | 21 | 14 | 13 | 13 |
| Very easy | 50+ | 37- | 46 | 43 | 43 |
| Somewhat easy | 35- | 40 | 38 | 43 | 42 |
| Somewhat difficult | 11 | 18+ | 13 | 12 | 12 |
| Very difficult | 3 | 2 | 2 | 1 | 2 |
| DK/Refused | 1 | 2 | 1 | 1 | 1 |
Officers who worked at an advance poll (45%), an ordinary poll (43%), or both poll types (46%) were significantly more likely to find the various forms "very easy" to complete than those who worked at mobile polls (33%).
Deputy returning officers (TOP2: 87%), information officers (TOP2: 89%), and registration officers (TOP2: 95%) were significantly more likely to report the various forms as easy to complete compared with poll clerks (81%). Further, deputy returning officers (BTM2: 13%), central poll supervisors (BTM2: 15%), and poll clerks (BTM2: 18%) were significantly more likely to find the various forms difficult to complete compared with information officers (BTM2: 7%) and registration officers (BTM2: 4%).
| Q12: Would you say that the various forms that were provided to you were (response) to complete? | Type of Poll | Staffing Position | ||||||||
|---|---|---|---|---|---|---|---|---|---|---|
|
Adv.
(n=232) |
Ord. (n=2997) | Adv. + ord. (n=224) | Mobile (n=49)* |
DRO
(n=1261) |
IO
(n=421) |
CPS (n=245) | RegO (n=315) | PC (n=1261) | Overall (n=3503) | |
| % | ||||||||||
| TOP2 | 86 | 85 | 87 | 79 | 87 | 89 | 84 | 95 | 81 | 85 |
| BTM2 | 13 | 13 | 13 | 20 | 13 | 7 | 15 | 4 | 18 | 13 |
| Very easy | 45 | 43 | 46 | 33- | 40 | 52+ | 39 | 58+ | 40 | 43 |
| Somewhat easy | 40 | 43 | 41 | 45 | 47 | 38- | 45 | 37- | 41 | 42 |
| Somewhat difficult | 11 | 12 | 13 | 17 | 12 | 6 | 15 | 4 | 15 | 12 |
| Very difficult | 2 | 2 | 1 | 3 | 1 | 1 | 1 | 0 | 3 | 2 |
| DK/Refused | 1 | 1 | 0 | 2 | 0 | 4 | 1 | 1 | 1 | 1 |
* Caution should be used when interpreting results due to small sample.
Lists of Electors
Overall, most (90%) of deputy returning officers, central poll supervisors, registration officers, and poll clerks were fairly or very satisfied with the lists of electors that were provided to them. Over nine in ten (92%) poll clerks reported being satisfied with the lists of electors. Deputy returning officers reported slightly lower levels of satisfaction (90%) when compared with 2011 (93%). Across regions, respondents in Ontario were more likely to be satisfied, while officers in Saskatchewan were less likely.
Chart 5: Satisfaction regarding the lists of electors
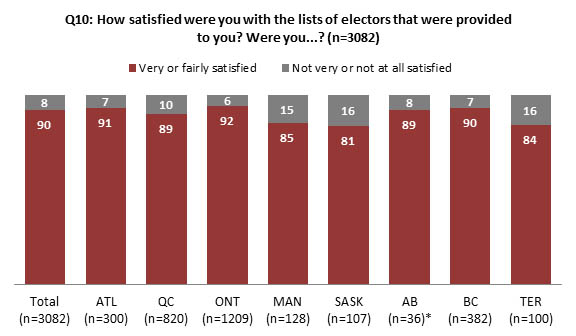
Text Description of "Chart 5 : Satisfaction regarding the lists of electors"
* Caution should be used when interpreting results due to small sample.
Base: Deputy Returning Officer, Central Poll Supervisor, Registration Officer, Poll Clerk
NOTE: Not all options listed. Some DROs (n=20) reported that they did not have to use the lists of electors.
Deputy returning officers, central poll supervisors, registration officers, and poll clerks who worked at a polling station on an Aboriginal reserve were significantly less likely (BTM2: 19%) to be satisfied with the lists of electors provided to them.
| Q10: How satisfied were you with the lists of electors that were provided to you? Were you...? | Polling Station | ||||
|---|---|---|---|---|---|
| Abo. Reserve (n=241) | Sen. / LT Care (n=788) | Stud. Res. (n=411) | Other (n=1769) | Overall (n=3209) | |
| % | |||||
| TOP2 | 80 | 88 | 86 | 90 | 90 |
| BTM2 | 19 | 11 | 10 | 8 | 8 |
| Very satisfied | 45- | 56 | 53 | 59 | 59 |
| Fairly satisfied | 34 | 32 | 33 | 31 | 31 |
| Not very satisfied | 11+ | 8 | 7 | 7 | 7 |
| Not at all satisfied | 9 | 3 | 3 | 1 | 2 |
| DK/Refused | 1 | 1 | 3 | 1 | 1 |
Base: Deputy Returning Officer, Central Poll Supervisor, Registration Officer, Poll Clerk
NOTE: Not all options listed. Some DROs (n=20) reported that they did not have to use the lists of electors.
Specified officers who worked at an ordinary poll were significantly more likely to report being "very satisfied" (60%) with the lists of electors compared with those who worked the advance polls (48%), both advance and ordinary polls (48%), and mobile polls (50%). Those who worked the mobile polls were less likely to report being satisfied with the lists of electors (BTM2: 14%) than those who worked the ordinary poll (BTM2: 8%).
| Q10: How satisfied were you with the lists of electors that were provided to you? Were you...? | Type of Poll | ||||
|---|---|---|---|---|---|
| Advance (n=219) | Ordinary (n=2645) | Adv. + ord. (n=174) | Mobile (n=47)* | Overall (n=3082) | |
| % | |||||
| TOP2 | 84 | 91 | 87 | 86 | 90 |
| BTM2 | 11 | 8 | 13 | 14 | 8 |
| Very satisfied | 48- | 60 | 48- | 50- | 59 |
| Fairly satisfied | 36 | 31 | 39+ | 35 | 31 |
| Not very satisfied | 8 | 6 | 10 | 12+ | 7 |
| Not at all satisfied | 3 | 1 | 3 | 2 | 2 |
| DK/Refused | 4 | 1 | 0 | 1 | 1 |
* Caution should be used when interpreting results due to small sample.
Base: Deputy Returning Officer, Central Poll Supervisor, Registration Officer, Poll Clerk
NOTE: Not all options listed. Some DROs (n=20) reported that they did not have to use the lists of electors.
Over a third (36%) of those who indicated being "not very satisfied" or "not at all satisfied" (n=348) with the lists of electors said that this was due to the fact that the information was incomplete/inaccurate. This was followed by over a quarter (28%) who believed the lists of electors were disorganized/inefficient, less than a fifth (17%) who indicated that the lists were not updated, and just under a tenth (9%) who had to add people to the list.
| Q11: Could you tell us why you were not satisfied with the lists of electors? | Overall (n=355) |
|---|---|
| % | |
| Information was incomplete / inaccurate / many mistakes | 36 |
| Disorganized/inefficient | 28 |
| List not updated / electors had moved out of area/died | 17 |
| Had to add people to list / names were missing | 9 |
| Should be done electronically | 1 |
| Other | 9 |
| DK/Refused | 0 |
Bingo Sheets
Overall, nine in ten (TOP2: 89%) central poll supervisors and poll clerks reported that the bingo sheets were very or somewhat easy to complete. For central poll supervisors, this represents a six percentage point increase from their 2011 results (83%).Footnote 9 Officers in the Atlantic Provinces (TOP2: 97%) were significantly more likely to find the bingo sheets easy to complete compared with their results from 2008 (TOP2: 84%).
To note, in 2011, this question was asked to central poll supervisors, information officers and deputy returning officers, whereas in 2015, this question was asked only to central poll supervisors and poll clerks.
Chart 6: Bingos sheets, by region
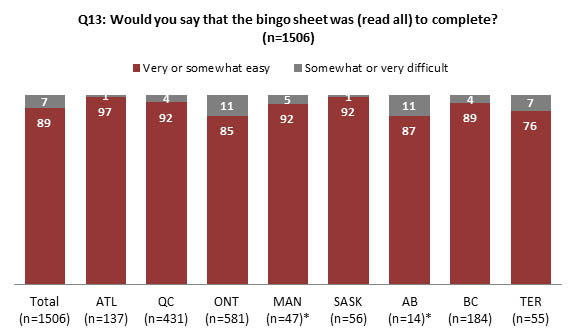
Text Description of "Chart 6 : Bingos sheets, by region"
* Caution should be used when interpreting results due to small sample.
Base: Central Poll Supervisor, Poll Clerk
Significantly fewer officers who worked in student residences reported that the bingo sheets were somewhat difficult to complete (3%) compared with officers who worked in Aboriginal reserve polling stations (10%).
| Q13: Would you say that the bingo sheet was (read all) to complete? | Polling Station | ||||
|---|---|---|---|---|---|
| Abo. Reserve (n=114) | Sen. / LT Care (n=356) | Stud. Res. (n=192) | Other (n=855) | Overall (n=1517) | |
| % | |||||
| TOP2 | 87 | 91 | 87 | 89 | 89 |
| BTM2 | 10 | 6 | 5 | 7 | 7 |
| Very easy | 67 | 65 | 65 | 63 | 64 |
| Somewhat easy | 20 | 27 | 23 | 26 | 26 |
| Somewhat difficult | 10+ | 6 | 3 | 6 | 6 |
| Very difficult | 0 | 0 | 3 | 1 | 1 |
| DK/Refused | 3 | 3 | 7 | 4 | 4 |
Base: Central Poll Supervisor, Poll Clerk
Officers who worked in mobile and ordinary polls (TOP2: 90%, each) were significantly more likely to find the bingo sheets easy to complete compared with those who worked in both advance and ordinary polls (TOP2: 78%).
| Q13: Would you say that the bingo sheet was (read all) to complete? | Polling Station | ||||
|---|---|---|---|---|---|
| Advance (n=102) | Ordinary (n=1283) | Adv. + ord. (n=100) | Mobile (n=21)* | Overall (n=1517) | |
| % | |||||
| TOP2 | 85 | 90 | 78 | 90 | 89 |
| BTM2 | 6 | 6 | 14 | 5 | 7 |
| Very easy | 64 | 64 | 53- | 64 | 64 |
| Somewhat easy | 21 | 26 | 25 | 26 | 26 |
| Somewhat difficult | 6 | 5 | 14+ | 4 | 6 |
| Very difficult | 0 | 1 | 0 | 0 | 1 |
| DK/Refused | 9 | 4 | 8 | 5 | 4 |
* Caution should be used when interpreting results due to small sample.
Base: Central Poll Supervisor, Poll Clerk
Candidates' Representatives' Usage of Bingo Sheets
Over half (56%) of election officers from the sample of central poll supervisors, poll clerks and information officers from ordinary and mobile polls indicated that candidates' representatives picked up the bingo sheets as soon as there were updates available – no change from 2011. Officers in Quebec (62%) were significantly more likely to indicate that candidates' representatives picked up the bingo sheets as soon as they were available, while those in Alberta (44%), Manitoba (35%), and Saskatchewan (34%) were significantly less likely.
| Q14: On election day, did the candidates' representatives generally pick up the bingo sheets as soon as there were updates available? | Region | ||||||||
|---|---|---|---|---|---|---|---|---|---|
| ATL (n=167) | QC (n=459) | ON (n=632) | MAN (n=69) | SASK (n=56) | AB (n=15*) | BC (n=205) | TER (n=57) | Overall (n=1659) | |
| % | |||||||||
| Yes | 52 | 62+ | 58 | 39- | 40- | 39- | 55 | 42- | 56 |
| No | 29 | 18 | 23 | 35+ | 34 | 44+ | 27 | 26 | 24 |
| Almost always | 12 | 14 | 14 | 13 | 10 | 11 | 9 | 9 | 13 |
| DK/Refused | 7 | 6 | 5 | 14 | 16 | 6 | 10 | 23 | 7 |
* Caution should be used when interpreting results due to small sample.
Base: Central Poll Supervisor, Poll Clerk, Information Officer at ordinary polls and mobile polls on election day
Election officers in seniors' homes were significantly less likely to report that candidates' representatives were generally picking up the bingo sheets in as soon as they were available.
| Q14: On election day, did the candidates' representatives generally pick up the bingo sheets as soon as there were updates available? | Polling Station | ||||
|---|---|---|---|---|---|
| Abo. Reserve (n=133) | Sen. / LT Care (n=347) | Stud. Res. (n=203) | Other (n=898) | Overall (n=1581) | |
| % | |||||
| Yes | 44+ | 20- | 49+ | 57 | 56 |
| No | 45 | 64+ | 25 | 23 | 24 |
| Almost always | 2- | 5 | 13 | 13 | 13 |
| DK/Refused | 9 | 11 | 13 | 7 | 7 |
Base: Central Poll Supervisor, Poll Clerk, Information Officer at ordinary polls and mobile polls on election day
Similar to 2011, election officers reported that candidates' representatives were significantly less likely to pick up the bingo sheets in a timely manner at mobile polls.
| Q14: On election day, did the candidates' representatives generally pick up the bingo sheets as soon as there were updates available? | Type of Poll | Staffing Position | ||||
|---|---|---|---|---|---|---|
|
Ordinary
(n=1636) |
Mobile (n=23)* |
IO
(n=354) |
CPS
(n=193) |
PC
(n=1112) |
Overall (n=1659) | |
| % | ||||||
| Yes | 56 | 23- | 53 | 44- | 59 | 56 |
| No | 23 | 55+ | 21 | 32+ | 23 | 24 |
| Almost | 13 | 4- | 18 | 24 | 9 | 13 |
| DK/Refused | 7 | 18 | 8 | 0 | 9 | 7 |
* Caution should be used when interpreting results due to small sample.
Base: Central Poll Supervisor, Poll Clerk, Information Officer at ordinary polls and mobile polls on election day
Just over a tenth (13%) of election officers from the sample of central poll supervisors, poll clerks, and information officers from advance polls reported that on advance voting days, candidates' representatives generally took photos of the bingo sheets.
| Q15: On advance voting days, did the candidates' representatives generally take photos of the bingo sheets? | Overall (n=119) |
|---|---|
| % | |
| Yes | 13 |
| No | 73 |
| Not always / Sometimes | 0 |
| DK/Refused | 15 |
Base: Central Poll Supervisor, Poll Clerk, Information Officer at advance poll only
Return to source of Footnote 6 N values: ATL (n=346); QC (n=924); ONT (n=1385); MAN (n=154); SASK (n=115); AB (n=39); BC (n=423); TER (n=115)
Return to source of Footnote 7 Results with less than 5% of mentions not shown
Return to source of Footnote 8 "Poor training" is specific to the instructor's competency in training staff with provided materials.
Return to source of Footnote 9 Note that the survey of election officers did not include poll clerks in 2011.