 Site Menu
Survey of Election Officers Following the 42nd Federal General Election
8. Experience at The Polls
This section presents findings related to election officers' experiences at the poll. This focuses on the flow of electors, registration of electors, candidates' representatives, responding to electors in their official language (English or French) and exceptional cases that occurred.
Flow of Electors
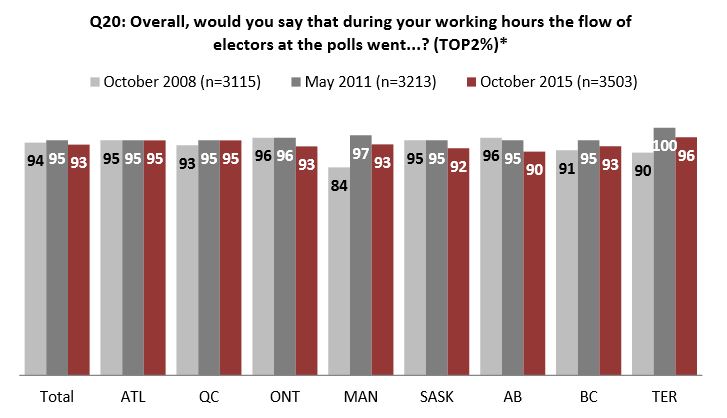
Similar to previous election years (2008 and 2011), ninety-three percent (TOP2: 93%) of election officers in 2015 found that the flow of electors went smoothly. By region, the flow of electors mostly varied between ± 1–4% from 2011 to 2015, except for the case of Alberta, whose rating of flow of electors decreased from 95% in 2011 to 90% in 2015.
Chart 14 : Flow of electors, by regionFootnote 14
Text Description of "Chart 14 : Flow of electors, by region"
* TOP2 (very smoothly + somewhat smoothly)
In regard to the type of poll, the percentage of officers who worked in ordinary polls who reported that the flow of electors went very or somewhat smoothly (TOP2: 95%) was the same as the overall average (TOP2: 95%). That was significantly more than officers who worked at both advance and ordinary polls (TOP2: 89%).
By staffing position, deputy returning officers (TOP2: 96%) and poll clerks (TOP2: 95%) were significantly more likely to report that the flow of electors went smoothly compared with central poll supervisors (TOP2: 90%).
| Q20: Overall, would you say that during your working hours the flow of electors at the poll went...? | Type of Poll | Staffing Position | ||||||||
|---|---|---|---|---|---|---|---|---|---|---|
|
Adv.
(n=232) |
Ord. (n=2997) | Adv. + ord. (n=224) | Mobile (n=49)* |
DRO
(n=1261) |
IO
(n=421) |
CPS (n=245) | RegO (n=315) | PC (n=1261) | Overall (n=3503) | |
| % | ||||||||||
| TOP2 | 93 | 95+ | 89 | 95 | 96+ | 95 | 90 | 95 | 95 | 95 |
| BTM2 | 7 | 4 | 10 | 5 | 4 | 6 | 10 | 5 | 5 | 5 |
| Very smoothly | 65 | 68 | 63 | 65 | 69 | 67 | 66 | 68 | 65 | 67 |
| Somewhat smoothly | 29 | 28 | 27 | 29 | 27 | 28 | 25 | 26 | 30 | 28 |
| Not very smoothly | 5 | 3 | 6 | 3 | 2 | 2 | 7+ | 3 | 4 | 3 |
| Not at all smoothly | 2 | 2 | 4 | 1 | 2 | 4+ | 2 | 2 | 1 | 2 |
| DK/Refused | 0 | 0 | 1 | 1 | 1 | 0 | 0 | 1 | 0 | 0 |
* Caution should be used when interpreting results due to small sample.
Of those officers reporting that the flow electors did not go very smoothly or not at all smoothly (n=172), the top three reasons they cited for the lack of elector flow were these (in decreasing percentage): long line-ups (19%), disorganization (19%), and too many voters at the polling station (14%).
| Q21: Why do you say that? | Overall (n=172) |
|---|---|
| % | |
| Long line-ups / too much waiting / took too long | 19 |
| Disorganized/confusion | 19 |
| Too many voters / crowded | 14 |
| Not enough space | 11 |
| Staff not prepared for work | 8 |
| Needed more staff / help | 7 |
| Issues with voter list | 3 |
| Issues with forms | 3 |
| Need improvement in assisting persons with disabilities | 2 |
| Issues with paperwork | 1 |
| Other | 9 |
| DK/Refused | 3 |
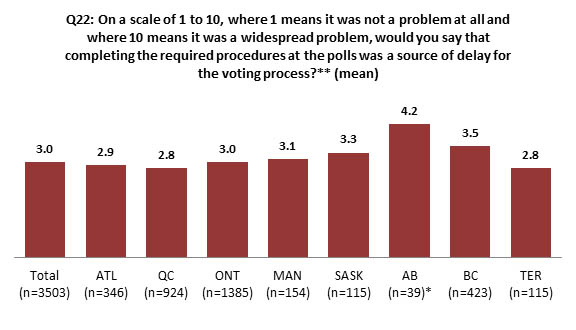
When asked to rate if completing the required procedures at the polls was a source of delay for the voting process, from 1 (no problem at all) to 10 (widespread problem), officers in Alberta were significantly more likely to report experiencing problems with completing the required procedures at the polls (average of 4.2) compared with other regions (national average of 3.0). Officers in British Columbia were also more likely to report experiencing problems with completing the required procedures at the polls (average of 3.5) compared with other regions, with the exception of Saskatchewan and Manitoba.
Chart 15 : Average problems with completing required procedures at the polls, by region
Text Description of "Chart 15 : Average problems with completing required procedures at the polls, by region"
* Caution should be used when interpreting results due to small sample.
** DK/Refused respondents excluded from mean calculation.
When asked to rate if completing the required procedures at the polls was a source of delay for the voting process, officers who worked in ordinary polls were significantly less likely to report having problems with completing the required procedures at the polls (average of 2.9) than officers who worked in advance polls (average of 3.6), both advance and ordinary polls (average of 3.6), and mobile polls (average of 3.5).
Registration of Electors
Overall, over four-fifths (TOP2: 86%) of election officers from the sample of deputy returning officers, central poll supervisors, and registration officers (n=1821) reported registering electors to be easy. However, significantly fewer officers in Alberta reported that registering electors was very or somewhat easy (TOP2: 72%) than the other regions, with the exception of Saskatchewan and British Columbia. Further, officers in Alberta (BTM2: 24%) and Saskatchewan (BTM2: 20%) were significantly more likely to report that registering electors was not easy compared with other regions.
| Q23: Would you say that it was (read all) to register electors? | Region | ||||||||
|---|---|---|---|---|---|---|---|---|---|
| ATL (n=189) | QC (n=448) | ON (n=737) | MAN (n=93) | SASK (n=58) | AB (n=23)* | BC (n=223) | TER (n=49)* | Overall (n=1821) | |
| % | |||||||||
| TOP2 | 87 | 90 | 84 | 94 | 76 | 72 | 81 | 87 | 86 |
| BTM2 | 10 | 7 | 10 | 7 | 20 | 24 | 15 | 13 | 10 |
| Very easy | 46 | 46 | 47 | 57+ | 35- | 41 | 48 | 47 | 47 |
| Somewhat easy | 41 | 43+ | 37 | 37 | 41 | 31- | 33 | 40 | 39 |
| Somewhat difficult | 10 | 6 | 9 | 7 | 13 | 21+ | 15+ | 13 | 9 |
| Very difficult | 0 | 1 | 1 | 0 | 7 | 3 | 0 | 0 | 1 |
| DK/Refused | 1 | 1 | 1 | 0 | 2 | 0 | 0 | 0 | 1 |
* Caution should be used when interpreting results due to small sample.
Base: Deputy Returning Officer, Central Poll Supervisor, Registration Officer
NOTE: Not all options listed. Some DROs (n=60) reported that no elector had to be registered.
Officers who worked at ordinary polls were significantly more likely to report that the process of registering electors was "somewhat easy" (40%) than officers who worked at advance polls (28%). Otherwise there were no significant differences in the ease of registering electors based on staffing position.
| Q23: Would you say that it was (read all) to register electors? | Type of Poll | ||||
|---|---|---|---|---|---|
| Advance (n=122) | Ordinary (n=1554) | Adv. + ord. (n=118) |
Mobile
(n=26)* |
Overall (n=1821) | |
| % | |||||
| TOP2 | 80 | 86 | 84 | 83 | 86 |
| BTM2 | 14 | 10 | 14 | 17 | 10 |
| Very easy | 52+ | 46 | 51+ | 42 | 47 |
| Somewhat easy | 28- | 40 | 33- | 40 | 39 |
| Somewhat difficult | 12 | 9 | 10 | 14+ | 9 |
| Very difficult | 2 | 1 | 4 | 2 | 1 |
| DK/Refused | 1 | 1 | 0 | 1 | 1 |
* Caution should be used when interpreting results due to small sample.
Base: Deputy Returning Officer, Central Poll Supervisor, Registration Officer
NOTE: Not all options listed. Some DROs (n=60) reported that no elector had to be registered.
From the specified sample, eighty-seven percent (TOP2: 87%) reported that it was very or somewhat easy to use the forms when registering an elector. However, officers in Alberta were significantly less likely to report finding the forms very or somewhat easy (TOP2: 74%) compared with officers in other provinces, with the exception of Saskatchewan and the Territories. Similarly, officers in Saskatchewan were significantly less likely to report finding the forms very or somewhat easy (TOP2: 78%) to use compared with officers in Quebec (TOP2: 89%) and Manitoba (TOP2: 93%).
| Q24: Would you say that when registering an elector it was (read all) to use the forms? | Region | ||||||||
|---|---|---|---|---|---|---|---|---|---|
| ATL (n=189) | QC (n=448) | ON (n=737) | MAN (n=93) | SASK (n=58) | AB (n=23)* | BC (n=223) | TER (n=49)* | Overall (n=1821) | |
| % | |||||||||
| TOP2 | 87 | 89 | 87 | 93 | 78 | 74 | 84 | 86 | 87 |
| BTM2 | 9 | 6 | 6 | 3 | 16 | 20 | 9 | 14 | 7 |
| Very easy | 48 | 44 | 51 | 58+ | 39- | 38- | 44 | 52+ | 48 |
| Somewhat easy | 39 | 46+ | 36 | 35 | 39 | 37 | 40 | 33- | 39 |
| Somewhat difficult | 9 | 6 | 6 | 3 | 13+ | 18+ | 9 | 14+ | 7 |
| Very difficult | 0 | 0 | 0 | 0 | 2 | 5 | 0 | 0 | 0 |
| DK/Refused | 1 | 0 | 0 | 2 | 5 | 0 | 0 | 0 | 1 |
* Caution should be used when interpreting results due to small sample.
Base: Deputy Returning Officer, Central Poll Supervisor, Registration Officer
NOTE: Not all options listed. Some DROs (n=91) reported that they did nothave to deal with the registration of electors.
From the specified sample, there were no significant differences in how officers reported the ease of using the forms to register electors based on type of poll worked.
| Q24: Would you say that when registering an elector it was (read all) to use the forms? | Type of Poll | ||||
|---|---|---|---|---|---|
| Advance (n=122) | Ordinary (n=1554) | Adv. + ord. (n=118) |
Mobile
(n=26)* |
Overall (n=1821) | |
| % | |||||
| TOP2 | 84 | 87 | 90 | 86 | 87 |
| BTM2 | 7 | 8 | 6 | 12 | 7 |
| Very easy | 44 | 48 | 49 | 51 | 48 |
| Somewhat easy | 40 | 39 | 41 | 36 | 39 |
| Somewhat difficult | 6 | 7 | 6 | 10 | 7 |
| Very difficult | 1 | 0 | 0 | 2 | 0 |
| DK/Refused | 0 | 1 | 1 | 0 | 1 |
* Caution should be used when interpreting results due to small sample.
Base: Deputy Returning Officer, Central Poll Supervisor, Registration Officer
NOTE: Not all options listed. Some DROs (n=91) reported that they did nothave to deal with the registration of electors.
Candidates' Representatives
Overall, only six percent (6%) of election officers witnessed problems related to the duties of candidates' representatives.
Chart 16: Problems related to duties of candidates' representatives, overall
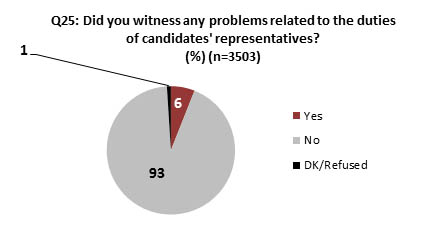
Text Description of "Chart 16 : Problems related to duties of candidates' representatives, overall"
Of those who witnessed problems related to the duties of candidates' representatives (n=216), about a third (30%) indicated that they interfered with the voting process. Other commonly cited reasons shared a similar theme of general non-cooperation inside the polling station, including staff were not properly prepared or did not know how to do the job (17%) and staff were inconsiderate, ill-mannered or inattentive (11%).
| Q26: Could you tell us the nature of the problems you witnessed? | Overall (n=216) |
|---|---|
| % | |
| Interfered with the voting process | 30 |
| Staff were not properly prepared / did not know how to do job | 17 |
| Staff were inconsiderate/ill-mannered/inattentive | 11 |
| Handled ballots during the count | 7 |
| Sat at the same table as the deputy returning officer and poll clerk or the registration officer | 7 |
| Handled an elector's identification | 5 |
| Took photographs or made audio or video recordings at the polling station | 4 |
| Displayed partisan symbols or material inside or near a polling place | 3 |
| Other | 16 |
| DK/Refused | 12 |
Responding to Electors in their Choice of Official Language
Almost all (99%) election officers reported that they did not encounter any difficulties in providing services to electors in their choice of official language. Across regions, officers in Manitoba and Saskatchewan did not report any difficulties in providing services to electors in their choice of official language (100% each).
In regard to type of poll, officers who worked the advance or mobile poll (4% each) were significantly more likely to encounter issues than those who worked at both advance and ordinary polls (0%). Further, officers who worked at a polling station on an Aboriginal reserve (4%) or a seniors' home (3%) were significantly more likely to report encountering difficulties providing services to electors in their choice of official language compared with officers who worked at a student residence polling station (1%).
| Q27: Did you encounter any difficulties in providing services to electors in the official language, English or French, of their choice? | Region | ||||||||
|---|---|---|---|---|---|---|---|---|---|
| ATL (n=346) | QC (n=924) | ON (n=1385) | MAN (n=154) | SASK (n=115) | AB (n=39)* | BC (n=423) | TER (n=115) | Overall (n=3503) | |
| % | |||||||||
| Yes | 1 | 1 | 1 | 0 | 0 | 4 | 2 | 3 | 1 |
| No | 98 | 99 | 99 | 100 | 100 | 96 | 98 | 97 | 99 |
| DK/Refused | 1 | 0 | 0 | 0 | 0 | 1 | 0 | 0 | 0 |
* Caution should be used when interpreting results due to small sample.
When officers who identified having difficulties providing services in the official language (n=43) were asked how these concerns were resolved, they cited: a French/English interpreter was needed (29%), staff member or supervisor provided translation (23%), other language/English interpreter was needed (12%), and a non-staff member translated in the requested language (11%).
| Q28: Could you tell us what was done to solve these difficulties? | Overall (n=43) |
|---|---|
| % | |
| French / English interpreter was needed | 29 |
| A staff member or supervisor translated | 23 |
| Other language–English interpreter was needed | 12 |
| A non-staff person translated | 11 |
| Staff or supervisor tried their best (resolution unclear) | 6 |
| The voter could understand enough English | 6 |
| Phoned outside for help | 5 |
| Nothing / issue was not resolved | 1 |
| Other | 9 |
| DK/Refused | 5 |
Exceptional Cases
Overall, eighty-four percent (TOP2: 84%) of specified election officers found it easy to deal with exceptional cases, such as completing various certificates or administering oaths. Regionally, significantly more officers in the Atlantic Provinces (86%) and Ontario (87%) found completing various certifications or administering oaths very or somewhat easy compared with British Columbia (78%) and Alberta (79%). Additionally, officers in Quebec and Alberta were significantly more likely to find it "somewhat easy" (46% each) to deal with exceptional cases than officers in Ontario (38%).
| Q29: How easy was it to deal with exceptional cases; for example: completing various certificates or administering oaths? | Region | ||||||||
|---|---|---|---|---|---|---|---|---|---|
| ATL (n=300) | QC (n=820) | ON (n=1209) | MAN (n=128) | SASK (n=107) | AB (n=36)* | BC (n=382) | TER (n=100) | Overall (n=3082) | |
| % | |||||||||
| TOP2 | 86 | 80 | 87 | 85 | 81 | 79 | 78 | 85 | 84 |
| BTM2 | 9 | 14 | 10 | 13 | 14 | 19 | 19 | 11 | 13 |
| Very easy | 47+ | 35- | 49+ | 43 | 33- | 32- | 38- | 35- | 42 |
| Somewhat easy | 39 | 46 | 38 | 42 | 48 | 46 | 40 | 49 | 41 |
| Somewhat difficult | 8 | 13 | 9 | 13 | 11 | 18 | 16 | 11 | 11 |
| Very difficult | 1 | 1 | 1 | 0 | 3 | 1 | 3 | 0 | 1 |
| DK/Refused | 2 | 3 | 2 | 2 | 4 | 0 | 1 | 2 | 2 |
* Caution should be used when interpreting results due to small sample.
Base: Deputy Returning Officer, Central Poll Supervisor, Registration Officer, Poll Clerk
NOTE: Not all options listed. Some DROs (n=52) reported that they did nothave to deal with the registration of electors.
Officers who worked at a polling station on an Aboriginal reserve were significantly more likely to find completing various certificates or administering oaths very or somewhat easy (TOP2: 86%) compared with student residences (TOP2: 81%) and seniors' homes polling stations (TOP2: 79%).
| Q29: How easy was it to deal with exceptional cases; for example: completing various certificates or administering oaths? | Polling Station | ||||
|---|---|---|---|---|---|
| Abo. Reserve (n=241) | Sen. / LT Care (n=788) | Stud. Res. (n=411) | Other (n=1769) | Overall (n=3209) | |
| % | |||||
| TOP2 | 86 | 79 | 81 | 84 | 84 |
| BTM2 | 12 | 15 | 15 | 12 | 13 |
| Very easy | 56+ | 38 | 45 | 42 | 42 |
| Somewhat easy | 30- | 41 | 36- | 42 | 41 |
| Somewhat difficult | 11 | 13 | 14 | 11 | 11 |
| Very difficult | 1 | 2 | 1 | 1 | 1 |
| DK/Refused | 1 | 3 | 2 | 2 | 2 |
Base: Deputy Returning Officer, Central Poll Supervisor, Registration Officer, Poll Clerk
NOTE: Not all options listed. Some DROs (n=52) reported that they did not have to deal with the registration of electors.
By type of poll, officers who worked at advance polls were more likely to report that completing various certificates or administering oaths was very or somewhat easy (TOP2: 86%) than officers who worked at mobile polls (TOP2: 77%).
| Q29: How easy was it to deal with exceptional cases; for example: completing various certificates or administering oaths? | Type of Poll | ||||
|---|---|---|---|---|---|
| Advance (n=216) | Ordinary (n=2645) | Adv. + ord. (n=174) |
Mobile
(n=47)* |
Overall (n=3082) | |
| % | |||||
| TOP2 | 86 | 83 | 86 | 77 | 84 |
| BTM2 | 8 | 13 | 14 | 18 | 13 |
| Very easy | 48+ | 42 | 45 | 38- | 42 |
| Somewhat easy | 38- | 42 | 41 | 40 | 41 |
| Somewhat difficult | 8 | 12 | 11 | 15+ | 11 |
| Very difficult | 0 | 1 | 3 | 2 | 1 |
| DK/Refused | 5 | 2 | 0 | 2 | 2 |
* Caution should be used when interpreting results due to small sample.
Base: Deputy Returning Officer, Central Poll Supervisor, Registration Officer, Poll Clerk
NOTE: Not all options listed. Some DROs (n=52) reported that they did not have to deal with the registration of electors.
Over a third (34%) of election officers who found dealing with the exceptional cases difficult (n=384) indicated it was because electors didn't understand or were reluctant. The remaining difficulties included issues with not being adequately prepared or trained (31%), the process being too complex (26%), and issues with paperwork, such as there were too many forms (24%), it was too difficult to use the forms (19%), and they lacked or were missing the forms or tools (7%).
There were some variances and similarities across polling station, type of poll, and staffing position. Officers who worked in seniors' homes polling stations were significantly more likely to cite that electors didn't understand or were reluctant for their reasons for finding it difficult to deal with exceptional cases (45%) than officers who worked in student residences (22%).
By type of poll, officers who worked at advance (20%) and mobile polls (34%) were significantly more likely to cite forms that were too difficult to use as a reason why they found it difficult to deal with exceptional cases compared with those who worked at advance polls (5%). Officers who worked at both advance and ordinary polls (62%) were significantly more likely to report that electors didn't understand or were reluctant than the other polling station types.
Deputy returning officers (34%), central poll supervisors (24%), and poll clerks (24%) were significantly more likely to cite that it was too complex to deal with exceptional cases than registration officers (3%).
| Q30: Why do you say that? | Overall (n=384) |
|---|---|
| % | |
| Electors didn't understand or were reluctant | 34 |
| Not well prepared/trained | 31 |
| Too complex | 26 |
| Too many forms | 24 |
| Too difficult to use the forms | 19 |
| Lack or missing tools or forms | 7 |
| DK/Refused | 4 |
Return to source of Footnote 14 N values: ATL (n=346); QC (n=924); ONT (n=1385); MAN (n=154); SASK (n=115); AB (n=39); BC (n=423); TER (n=115)