 Site Menu
Estimation of Voter Turnout by Age Group and Gender at the 2015 General Election
Summary
Official turnout for the 42nd general election held on October 19, 2015, was 68.3%, 7.2 percentage points higher than the previous general election (61.1%) and 9.5 points higher than the all-time low of 58.8% registered for the 2008 election. This was the highest rate observed since the 35th general election in 1993, which garnered a turnout of 69.6%.
Since 2004, Elections Canada has used a sample of administrative data compiled in the course of administering the election to estimate voter turnout by age group and, since 2008, by gender, at the national, provincial and territorial levels. These administrative data, combined with those from the National Register of Electors, offer a more accurate way of measuring and studying turnout than survey-based studies, which consistently overestimate participation.
For Canadian federal elections, official voter turnout is calculated as the number of votes cast divided by the number of registered electors. Since registration coverage may vary over time and between different groups of electors, this study uses the estimated number of Canadian citizens of voting age as the denominator instead of the number of registered electors. Using this method, the "adjusted" national turnout figure for 2015 is 66.1%; it was 58.5% in 2011. All turnout estimates included in this report use the estimated size of the electoral population as the denominator.
In 2015, turnoutFootnote 1 gradually increased with age, from 57.1% for ages 18–24 to 78.8% for ages 65–74, and then declined to 67.4% for those 75 and over. This same general pattern has been seen in every general election since 2004, when these studies began. And as in 2011, among the 18–24 age group, those electors eligible to vote for the first time federally, i.e. those born between May 3, 1993, and October 19, 1997, voted at a higher rate (58.3%) than those who were previously eligible to vote (55.1%).
Compared with 2011, the "adjusted" turnout increased by 7.6 percentage points at the national level. This increase is basically attributable to stronger estimated participation by those aged 18–24 (+18.3), 25–34 (+12.3), 35–44 (+7.4), and to a lesser extent, those over age 75 (+7.1). Turnout by the two youngest groups, especially the age 18–24 bracket, saw the most significant increase since 2004, both for electors eligible to vote for the first time federally and those who were previously eligible.
Looking at differences between men and women, for the 2015 general election women participated at a higher rate (68.0%) than men (64.1%), and this was true across all age groups up to age 64, where men started participating more than women. This is the same pattern seen in the 2011 and 2008 elections.
The pattern of turnout by age is the same as in 2011 in each province and territory, with turnout lowest among those aged 18–24 and then increasing gradually with age up to the 65–74 age group. Women voted more than men up to age 65 in most jurisdictions, after which the situation reversed.
In 2015, 16% of electors used alternative voting methods, whether advance polls or special ballots. This rate, which has seen net growth from 2011 (9%), also tends to increase with age. In 2015, 12% of youth aged 18–24 used these methods; this figure rises to 26% for those aged 65–74. The most marked increase was noted in the 18–24 age group, where the rate more than doubled from 2011.
Acknowledgements
The current study is the result of the involvement of several sectors at Elections Canada. Christian Gagné was in charge of sample design and estimation; Fritz Pierre conducted the estimations of the electoral population; and Manchi Luc and Stephen Warner prepared the report.
We would like to thank Sylvie Jacmain and Patrick Gilliland, who oversaw the collection and capture of data from the selected lists of electors, and Miriam Lapp, Alain Pelletier, Pascal Barrette, Fritz Pierre, Daniel Larrivée and Clayton Block for their comments on previous versions of the report. We also thank Yves Morin of Statistics Canada for his review of the study's methodology.
Introduction
This report presents estimates of voter turnout by various demographic groups defined by age and gender, at the national, provincial and territorial levels for the 42nd general election, held on October 19, 2015. Comparisons with results from previous general elections are made where appropriate. Tables of the estimates presented here, along with their associated statistical margins of error, are provided on Elections Canada's website at www.elections.ca/res/rec/part/estim/42nd_GE_turnout_e.xlsx.
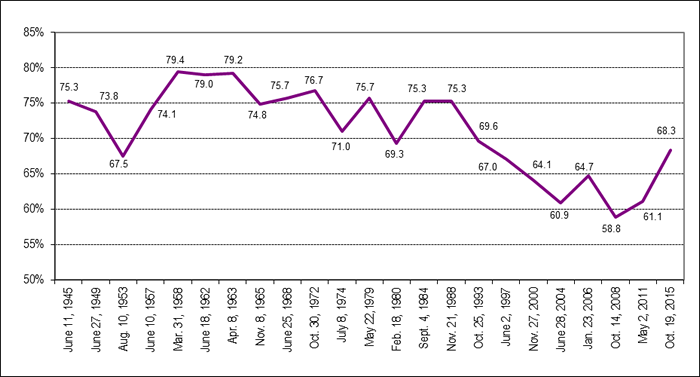
The official turnout for the 2015 election was 68.3%. This is the highest rate observed since the 35th general election, held in 1993, when the turnout was 69.6%. Historically, electoral participation peaked in Canada at 79.4% for the 1958 general election. Throughout the 1960s, turnout remained relatively high, fluctuating between 75% and 79%. The next two decades saw it decline slightly, but still ranging from 70% to 75%. In the 1990s, electoral participation began to decline to a historic low of 58.8% in the 2008 general election.
The decline in electoral participation has been the subject of much academic research and analysis. Most of this research has been based on estimates from surveys, which overestimate voter turnout.Footnote 2
According to section 18.1 of the Canada Elections Act, "[t]he Chief Electoral Officer may carry out studies on voting, including studies respecting alternative voting processes, and may devise and test an alternative voting process for future use in a general election or a by-election." Since 2004, after each general election, the Chief Electoral Officer has authorized the use of administrative data from the electoral process to produce turnout estimates by age group. This research is free of the inherent bias of survey-based studies. In 2008, breakdown by gender was added.
For Canadian federal elections, official voter turnout is calculated as the number of votes cast divided by the number of registered electors. Because registration rates vary over time, this measure can be misleading when comparing turnout from two different elections. That is, the differences observed in Figure 1 are partly due to changes in list coverage (the percentage of eligible electors on the list) over time. The list coverage can vary across different segments of the population (such as youth) as well as and by region.
Figure 1: Official Turnout Rates in Canadian General Elections 1945 to 2015*
Text version of graph "Official Turnout Rates in Canadian General Elections 1945 to 2015"
*Official turnout in Canada is based on the number of electors on the final list of electors.
To overcome these limitations, this study defines turnout as the number of votes cast divided by the estimated number of eligible voters, regardless of their registration status. Because these estimates are generally larger than the number of registered electors, the resulting turnout estimates are typically lower than official turnout figures. Therefore, comparisons over time and between demographic groups reflect only changes in participation, net of any variations in registration rates.
For the purposes of this study, the number of eligible voters was established by making adjustments to data drawn from the 2011 Census provided by Statistics Canada. More details on how turnout is defined, the methodology used to determine the size of the electoral population, and the sampling and estimation methodology are presented in the Appendix.
National turnout estimates
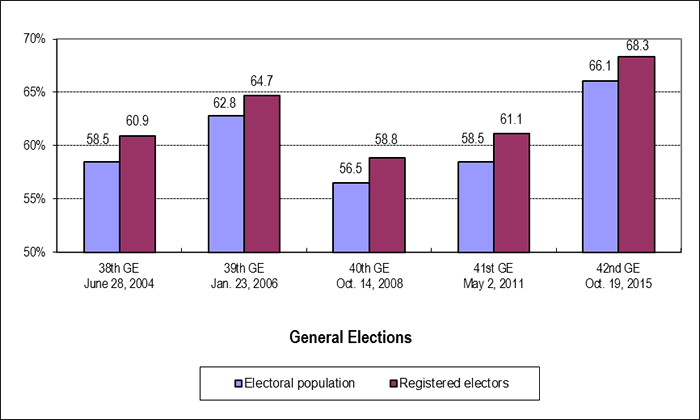
Replacing the number of registered electors with an estimate of the size of the electoral population in the denominator of the turnout measure does not change the observed trend in turnout since 2004, as shown in Figure 2. Using this alternative measure, participation still reached an all-time low in 2008, when 56.5% of the voting population voted. The 2015 election saw significant growth in participation, to 66.1%.
Figure 2: Voter Turnout Based on Registered Electors and Eligible Electors in the Population, General Elections 2004 to 2015
National turnout estimates by age group and gender
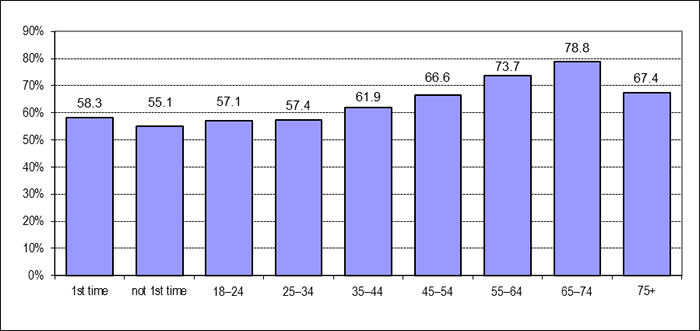
For the 2015 general election, the breakdown of participation by age group is shown in Figure 3. Turnout gradually increased with age from 57.1% for ages 18–24 to 78.8% for ages 65–74, and then declined to 67.4% for those 75 and older.Footnote 3 This same general pattern has been seen in every general election since 2004. For 2015, however, we also note that turnout for age groups 18–24 and 25–34 is closer to that of the 35–44 age group than in previous elections.
Figure 3: Voter Turnout by Age Group, 2015 General Election
Text version of graph "Voter Turnout by Age Group, 2015 General Election"
As in 2011, among the 18–24 age group, electors eligible to vote for the first time federally, i.e. those born between May 3, 1993, and October 19, 1997, voted at a higher rate (58.3%) than electors who were previously eligible to vote (55.1%).
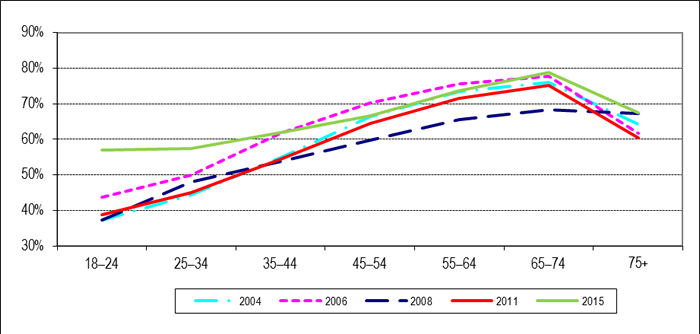
Figure 4 shows how turnout by age has evolved over the last five general elections. The same pattern is seen for each election. Compared to 2011, turnout is 18.3 percentage points higher for youth aged 18–24, 12.3 higher for those aged 25–34, 7.4 higher for those aged 35–44, and slightly higher for those over 75 (7.1 percentage points). The progressions in the other age groups are also statistically significant. Participation by the two youngest groups, especially the 18–24 group, saw the biggest increase since 2004, both for electors eligible to vote for the first time federally and those who were previously eligible.
Figure 4: Voter Turnout* by Age Group, General Elections 2004 to 2015
Text version of graph "Voter Turnout* by Age Group, General Elections 2004 to 2015"
٭The figures are not shown here due to space limitations, but can be found on Elections Canada's website at www.elections.ca/res/rec/part/estim/42nd_GE_turnout_e.xlsx.
Figure 5 shows turnout rates for the 2015 general election broken down by both age group and gender. The participation rate across all age groups was 64.1% for men and 68.0% for women (see Table 1). Women voted at higher rates than men in all age groups up to age 64, after which the trend reversed. All observed differences between genders are statistically significant at the 5% error level, except for the 65–74 age group.
Figure 5: Voter Turnout by Age Group and Gender, 2015 General Election
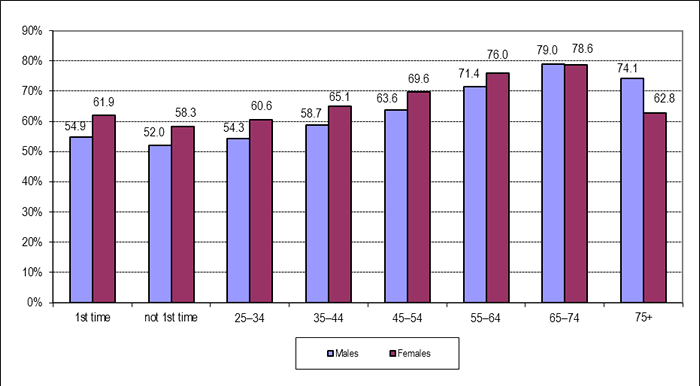
Text version of graph "Voter Turnout by Age Group and Gender, 2015 General Election"
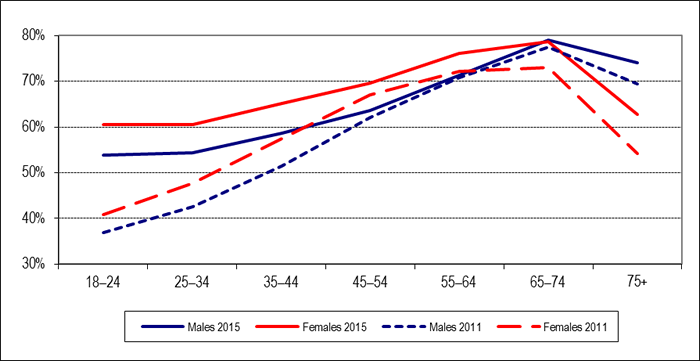
Figure 6 shows how turnout by age group and gender has changed between 2011 and 2015. Overall, turnout increased by 6.8 percentage points for men and 8.4 percentage points for women. The same general pattern was observed in both elections, but the differences between men and women were not so pronounced in 2011.
Figure 6: Voter Turnout* by Age Group and Gender, General Elections 2011 and 2015
Text version of graph "Voter Turnout* by Age Group and Gender, General Elections 2011 and 2015"
*The figures are not shown here due to space limitations, but can be found on Elections Canada's website at www.elections.ca/res/rec/part/estim/42nd_GE_turnout_e.xlsx.
Between the 2011 and 2015 elections, the most significant changes, for both genders, were noted for those under age 45 and those 75 and over: +16.9 percentage points for men and +19.6 for women for those aged 18–24; +11.8 for men and +12.9 for women for those aged 25–34; +7.2 for men and +7.6 for women for those aged 35–44; and +4.6 for men and +8.6 for women for those aged 75 and over.
Provincial and territorial turnout estimates
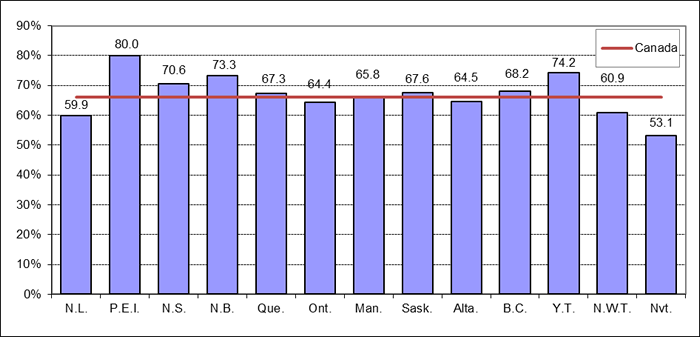
Figure 7 shows how voter turnout varies by province and territory compared to the 66.1% adjusted national figure for the 2015 general election. As in 2011, Prince Edward Island saw the highest turnout at 80.0%, and Nunavut the lowest at 53.1%. Turnout surpassed 70% in Nova Scotia (70.6%), New Brunswick (73.3%) and Yukon (74.2%). In all other provinces and territories, turnout ranged between 59.9% and 68.2%.
Figure 7: Voter Turnout by Province/Territory, 2015 General Election
Text version of graph "Voter Turnout by Province/Territory, 2015 General Election"
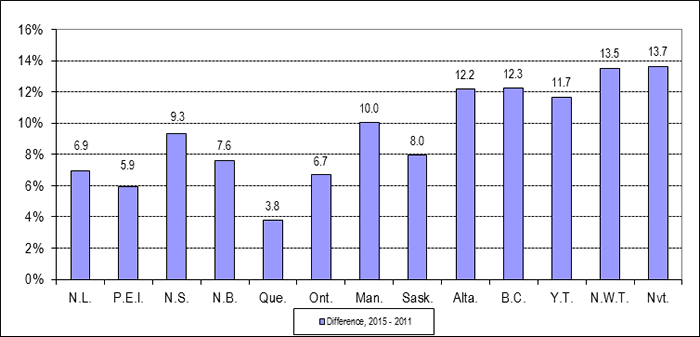
Figure 8 shows how turnout has changed within provinces and territories from the general election held in 2011 to that of 2015. Turnout increased everywhere, and generally by a substantial amount. The increase was particularly significant in Nunavut (13.7 percentage points), the Northwest Territories (13.5 percentage points), British Columbia (12.3 percentage points), Alberta (12.2 percentage points) and Yukon (11.7 percentage points). The weakest increase was posted in Quebec (3.8 percentage points).
Figure 8: Change in Voter Turnout by Province/Territory between the 2011 and 2015 General Elections
Provincial and territorial turnout estimates by age and gender
Breakdowns of turnout by age group and gender within provinces or territories for the 2015 election are provided in Table 1. The pattern by age is the same everywhere, with turnout lowest among the youngest and then increasing gradually with age up to the 65–74 age group, after which it starts to decline. The increase is most pronounced in Prince Edward Island (from 55 percentage points for those aged 18–24 to 96 percentage points for those aged 65–74) and Northwest Territories (from 40.9 percentage points for those aged 18–24 and 71.1 percentage points for those aged 65–74). The highest turnout for those aged 18–24 was in New Brunswick (65.2 points), followed by British Columbia (63.9 points) and Nova Scotia (61.1 points); the strongest increases from 2011 were in Nunavut (30.4 points), Saskatchewan (26.8 points) and Alberta (25.8 points). Differences between youth eligible to vote for the first time and those under 25 but previously eligible were not statistically significant at the provincial or territorial level, except in Alberta (6.0 percentage points higher for first time eligible) and Ontario (3.2 percentage points higher for first time eligible).
In the provinces and territories, as at the national level, women tended to have higher turnout rates than men up to age 64 in most jurisdictions, after which the situation reversed. However, the higher margins of error at this level lead to far fewer statistically significant differences.
| Age and Gender | N.L. | P.E.I. | N.S. | N.B. | Que. | Ont. | Man. | Sask. | Alta. | B.C. | Y.T. | N.W.T. | Nvt. | Canada |
|---|---|---|---|---|---|---|---|---|---|---|---|---|---|---|
| Men | 57.4 | 76.5 | 67.8 | 69.8 | 65.0 | 63.3 | 63.0 | 64.3 | 61.8 | 66.0 | 70.0 | 58.0 | 48.7 | 64.1 |
| 1st time* | 48.9 | 36.9 | 61.6 | 61.4 | 50.5 | 54.6 | 54.5 | 50.6 | 57.0 | 61.8 | 46.7 | 50.5 | 36.9 | 54.9 |
| not 1st time* | 44.5 | 53.8 | 48.2 | 55.5 | 48.9 | 51.6 | 53.4 | 52.8 | 54.3 | 56.9 | 61.7 | 31.8 | 46.8 | 52.0 |
| 18–24 | 47.3 | 42.9 | 56.4 | 59.2 | 49.9 | 53.5 | 54.1 | 51.5 | 55.9 | 60.0 | 52.9 | 43.4 | 40.6 | 53.8 |
| 25–34 | 41.0 | 58.7 | 52.9 | 56.5 | 54.2 | 53.1 | 52.1 | 60.0 | 55.7 | 56.9 | 60.9 | 54.0 | 46.2 | 54.3 |
| 35–44 | 48.7 | 75.9 | 60.9 | 65.8 | 60.3 | 57.1 | 61.5 | 58.7 | 56.9 | 61.1 | 56.0 | 60.5 | 49.1 | 58.7 |
| 45–54 | 58.6 | 82.9 | 67.5 | 73.3 | 64.4 | 63.0 | 61.5 | 64.2 | 61.2 | 64.4 | 75.4 | 58.9 | 51.8 | 63.6 |
| 55–64 | 65.8 | 78.2 | 77.2 | 75.2 | 73.6 | 70.6 | 69.7 | 73.6 | 69.1 | 69.6 | 78.6 | 66.6 | 60.8 | 71.4 |
| 65–74 | 69.8 | 99.0 | 81.3 | 82.0 | 80.1 | 78.9 | 75.7 | 75.8 | 76.2 | 79.9 | 97.6 | 70.6 | 58.5 | 79.0 |
| 75+ | 71.4 | 96.0 | 77.5 | 71.8 | 73.0 | 74.7 | 75.9 | 71.9 | 73.0 | 74.4 | 67.6 | 55.1 | 35.5 | 74.1 |
| Women | 62.3 | 83.1 | 73.2 | 76.6 | 69.5 | 65.4 | 68.4 | 70.9 | 67.2 | 70.3 | 78.5 | 64.0 | 57.8 | 68.0 |
| 1st time* | 48.1 | 68.3 | 67.5 | 72.3 | 56.6 | 60.3 | 63.8 | 61.9 | 67.2 | 70.1 | 65.1 | 29.8 | 48.3 | 61.9 |
| not 1st time* | 46.9 | 67.2 | 63.7 | 70.4 | 56.2 | 56.9 | 56.4 | 64.6 | 57.6 | 64.9 | 58.7 | 51.0 | 51.6 | 58.3 |
| 18–24 | 47.6 | 67.9 | 66.0 | 71.6 | 56.4 | 59.0 | 61.0 | 62.9 | 63.4 | 68.2 | 62.6 | 38.3 | 49.5 | 60.5 |
| 25–34 | 54.1 | 81.3 | 66.4 | 73.3 | 61.9 | 57.4 | 61.7 | 66.9 | 60.8 | 62.5 | 84.3 | 73.2 | 60.9 | 60.6 |
| 35–44 | 55.4 | 69.4 | 71.0 | 72.4 | 67.9 | 61.8 | 63.2 | 68.6 | 66.5 | 66.8 | 73.4 | 66.5 | 66.7 | 65.1 |
| 45–54 | 67.6 | 73.4 | 71.7 | 78.3 | 71.9 | 67.3 | 69.3 | 74.3 | 70.1 | 69.4 | 73.9 | 69.3 | 59.7 | 69.6 |
| 55–64 | 72.1 | 95.0 | 82.6 | 84.4 | 79.5 | 73.2 | 75.2 | 77.0 | 72.6 | 76.9 | 93.3 | 67.0 | 57.6 | 76.0 |
| 65–74 | 75.2 | 93.2 | 83.3 | 81.0 | 80.7 | 76.1 | 80.7 | 80.5 | 76.7 | 80.3 | 64.0 | 71.7 | 41.0 | 78.6 |
| 75+ | 49.7 | 99.0 | 64.3 | 68.8 | 60.7 | 61.6 | 69.4 | 65.7 | 62.1 | 66.7 | 99.0 | 48.5 | 35.0 | 62.8 |
٭The category "1st time" includes youth eligible to vote federally for the first time. For the 2015 general election, this includes those born between May 3, 1993, and October 19, 1997. The category "not 1st time" includes those youth under 25 who were previously eligible to vote federally. For the 2015 general election, this includes those born between October 20, 1990, and May 2, 1993.
Alternative voting methods
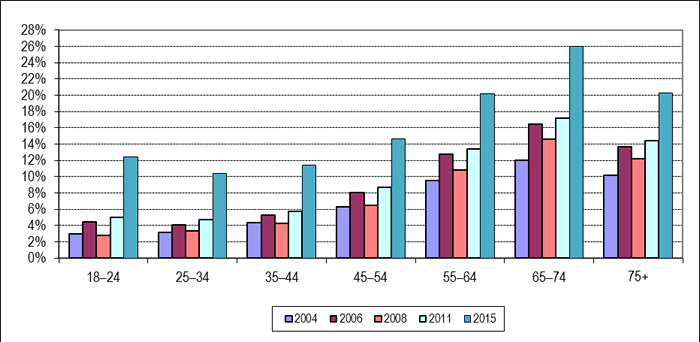
Voters can currently vote at advance polls or by special ballot if they wish, rather than on polling day. To see any trends in the use of these methods over time, Figure 9 shows the percentage of the electoral population, broken down by age group, who chose to use either of these alternative voting methods in each of the last five general elections.
The proportion of electors using these alternative methods increased substantially in 2015. In this general election, 16% of voters used such methods, compared with 9% in 2011. As was seen in previous elections, this proportion also increases with age. In 2015, about 11% of those aged 18–34 used one of these methods. The figure rose to 26% for those aged 65–74. The most pronounced increase was for those aged 18–24, where the percentage more than doubled from 2011.
Figure 9: Use of Advance Polls or Special Ballot by Age Group*, General Elections 2004 to 2015
*The figures are not shown here due to space limitations, but can be found on Elections Canada's website at www.elections.ca/res/rec/part/estim/42nd_GE_turnout_e.xlsx.
Conclusion
In 2015, the overall federal voter turnout based on eligible electors increased to 66.1% from 58.5% in 2011. This change is driven by stronger participation by youth aged 18–24 (18.3 percentage points), voters aged 25–34 (12.3 percentage points), 35–44 (7.4 percentage points) and, to a lesser extent, those aged 75 and over (7.1 percentage points). The remarkable increase in the two youngest groups is unprecedented.
Turnout steadily increased with age from 57.1% for ages 18–24 to 78.8% for ages 65–74, and then declined to 67.4% for those 75 and older.
For the 2015 general election, women participated at a higher rate (68.0%) than men (64.1%), with the exception of electors aged over 64, where men participated more than women.
The use of alternative voting methods, i.e. advance polls or special ballots, was up significantly in 2015 (16% in total) compared with 2011 (9%). As was seen in previous elections, this proportion also increases with age. In 2015, about 11% of those aged 18–34 used one of these alternative methods. This percentage increases regularly up to 26% for those aged 65–74. Use of advance polls or special ballots was higher in 2015 for all age groups than in each of the four previous elections.
Return to source of Footnote 1 The estimates of voter turnout have margins of error between 1 and 3 percentage points at the national level and for most of the age groups, between 1 and 12 percentage points at the provincial/territorial level. Actual participation rates should be within the associated margin of error 19 times out of 20. Throughout this document, a difference is said to be statistically significant at the 5% error level if the estimated difference is larger than the associated margin of error.
Return to source of Footnote 2 Surveys tend to over-report voting for at least two reasons. There is a selection bias because those who agree to participate in surveys also tend to be more likely to vote. There is also a response bias because some survey respondents will not admit they did not vote, because voting is viewed as socially desirable. See André Blais et al., 2002, Anatomy of a Liberal Victory: Making Sense of the 2000 Canadian Election. Peterborough: Broadview Press, p. 61.
Return to source of Footnote 3 Observed differences between age groups at the national level are statistically significant at the 5% error level, with the exception of the difference observed between the 18–24 and the 25–34 age groups. Throughout this document, a difference between two estimates is said to be statistically significant at the 5% error level if it is larger than its associated margin of error, as described in the Appendix.