Site Menu
Analysis of Financial Trends of Regulated Federal Political Entities, 20002014
5. Expenses
In regard to expenses, a significant legislative change in the period of 2003 to 2014 was the introduction of reporting requirements for expenses of EDAs, nomination contestants and leadership contestants in 2004. This provides a broader picture of the spending activities of federal political entities. The incidence of four general elections between 2003 and 2014 had an impact on the spending of registered parties and their candidates. From 2003 to 2014, election-related spending of both candidates and registered parties totalled $507 million, representing 36% of all expenses incurred in this time frame. The annual ongoing expenses of registered parties and EDAs were $843 million in this time period, which was 61% of all expenses incurred. The remaining $29 million that represent 3% of expenses were for leadership and nomination contests.
Event-Based Expenses vs. Annual Expenses
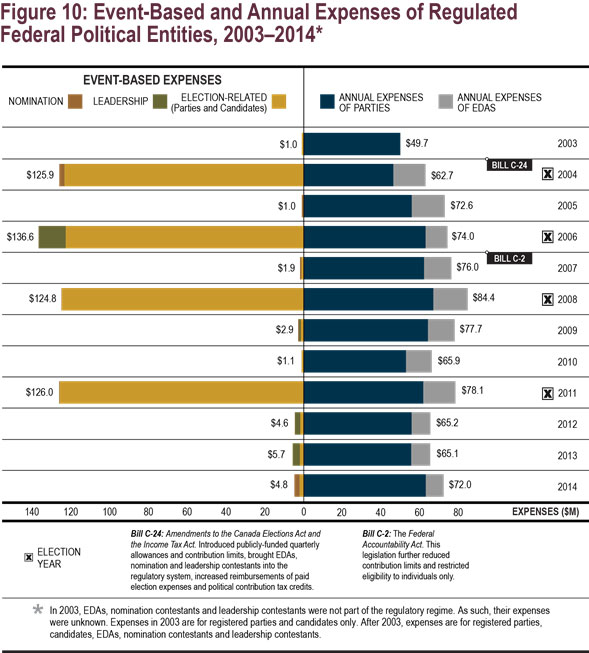
Event-based expenses result from an event, including an election or by-election for registered parties and candidates, as well as a leadership contest or a nomination contest.
Annual expenses are expenses incurred by registered parties and their EDAs for costs of maintaining activities as a continuing entity.
After the introduction of Bill C-24, from 2004 to 2014, regulated federal political entities incurred a total of $1.3 billion of annual and event-based expenses, of which $794 million were the annual expenses of registered parties and their affiliated EDAs and $535 million were event-based expenses; 95% of event-based expenses were related to elections.
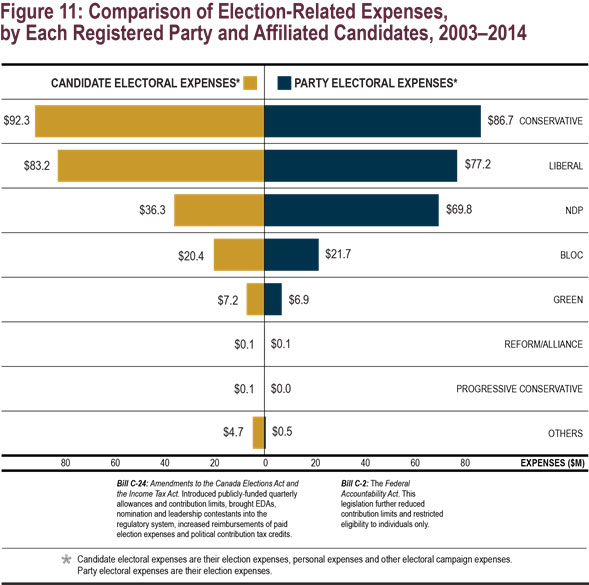
For general elections and by-elections from 2003 to 2014, registered parties incurred 52% of all related election expenses while candidates incurred 48%. For the most part, the spending split between registered parties and their candidates hovered around the 50% range. The only exception among the larger parties was the NDP; for all elections and by-elections between 2003 and 2014, the party spent close to twice the amount of its candidates.
In total, the Conservative Party and its candidates incurred 35% of all election-related expenses. The proportion was 32% for the Liberal Party and its candidates, 21% for the NDP and its candidates, 8% for the Bloc Québécois and its candidates, 3% for the Green Party and its candidates, and 1% for all other parties and their candidates as well as independents.
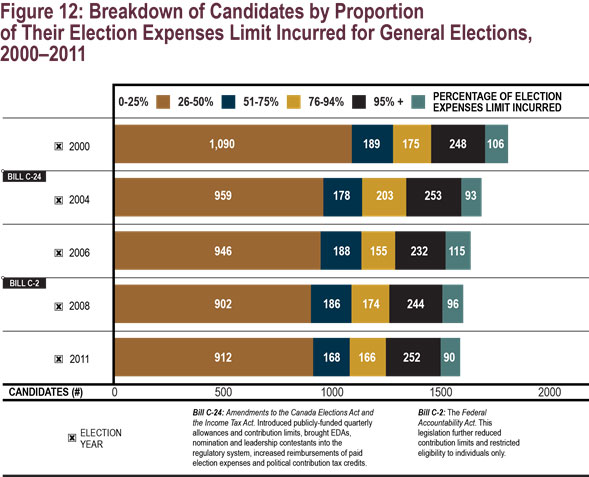
In the five general elections between 2000 and 2011, the majority of candidates (58%) spent 25% or less of their expenses limit. In contrast, 6% spent 95% or more of their limit. In the remaining categories, 15% incurred 76% to 94% of their limit, 11% incurred 26% to 50%, and 10% incurred 51% to 75%.