 Site Menu
National Youth Survey Report
SECTION 6: INTERVENTIONS WITH THE POTENTIAL TO INCREASE ELECTORAL PARTICIPATION
In sections 4 and 5, the motivation and access barriers associated with non-participation in the May 2011 General Election and with non-participation in the electoral process in general have been described. This section of the report uses the findings from the National Youth Survey to examine interventions which could be undertaken by Elections Canada with the potential to increase electoral participation among Canadian youth.
The regression analysis performed with the national random sample suggests that the interventions with the most short- to medium-term potential to increase youth electoral participation are those that address access barriers. Increasing process knowledge, mitigating challenges associated with personal circumstances and removing administrative barriers to voting are all important. At the same time, addressing motivation barriers through longer-term interventions has the potential to increase voter turnout, particularly for certain subgroups.
To inform future outreach activities, the socio-demographic profile and number of youth potentially impacted by interventions to increase motivation or remove access barriers is estimated in this section of the report.
6.1 Motivation Factors and Access Barriers to Voting
A motivation index and an access index were developed based on the variables identified in the regression model as accounting for most of the variance with voting behaviour. Details of the development of the indices are provided in Appendix A.
The motivation factors accounting for most of the variance in voting behaviour were:
- Belief that it is a civic duty for citizens to vote in elections (agreement on four-point scale)
- Influence of politicians in general (measured on four-point scale)
- Overall interest in the May 2011 General Election (interest on a four-point scale)
- Number of correct answers to three questions assessing political knowledge
- Knowing enough about the candidates to know who to vote for (agreement on a four-point scale)
The variables measuring the access barriers that accounted for most of the variance in the logistic regression model against voting behaviour were:
- Getting to the voting location (transportation) (influence of on four-point scale)
- Knowing when to vote (influence of on four-point scale)
- Number of different methods of voting named (i.e. advance poll, mail, and Election's Canada office)
- Education
- Perception that voting in a general election is easy and convenient (agreement on four-point scale)
6.2 Locating Youth into Access and Motivation Quadrants
Motivation and access barriers have been considered in a conceptual framework25 segmenting youth voters and non-voters (Figure 6‑1). This framework provides a way of thinking about the interrelated nature of motivation and access barriers. With these two dimensions in mind, youth voters were considered as belonging to one of four groups or quadrants.26 The motivation and access indices described above were used to classify respondents from the national random sample into the quadrants.
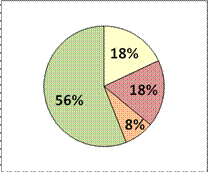
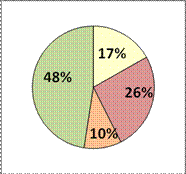
Figure 6‑1: Overview of Barriers to Electoral Participation
High Motivation and Few Access Barriers
56% of respondents
95% Voted in 2011 General Election
Limited potential to increase participation by targeting youth in this quadrant.
High motivation will mean youth overcome access barriers.
High Motivation but Many Access Barriers
18% of respondents
67% Voted in 2011 General Election
High potential to increase electoral participation by mitigating access barriers.
Access barriers are highly influential. Increasing process knowledge will assist in overcoming barriers.
Low Motivation but Few Access Barriers
8% of respondents
60% Voted in 2011 General Election
Increasing participation of youth in this quadrant may be achieved through a long-term approach to raising motivation.
Low Motivation and Many Access Barriers
18% of respondents
19% Voted in 2011 General Election
Potential to increase electoral participation by mitigating access barriers. However, even if access barriers are removed, motivation of youth in this segment will still need to be increased before they will participate.
6.2.1 Youth in the National Random Sample
- The largest group of respondents (56% of the national random sample) fell into the quadrant that was defined by high motivation and few access barriers (green). Voting was the norm among this group, as 95% reported voting in the May 2011 General Election.
- Another 18% of respondents were just as motivated to vote, but faced access barriers (yellow). Although voting participation among this group was still common, at 67%, approximately one-third were motivated to vote but did not.
- The smallest proportion of youth fell into the quadrant with few access barriers but low motivation to vote (orange). These 8% of respondents likely could have voted, but were not interested enough to exercise their democratic rights. Voting participation dropped to 60% in this group.
- The final group was the most challenged group (red). This group, consisting of 18% of respondents, faced many access barriers, and were not sufficiently motivated to vote to overcome them. Only 19% of this group reported voting.
Since respondents to the National Youth Survey reported higher participation rates than generally considered likely among Canadian youth, it may be that respondent's answers to motivation and access questions similarly present a more optimistic profile than among their peers. Caution should therefore be applied when extrapolating the proportions in Figure 6‑1 to the general population.
6.2.2 Youth in Subgroups
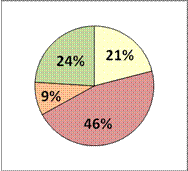
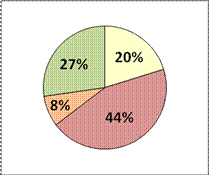
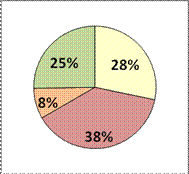
With the possible exception of youth with low motivation and few access barriers (orange), the proportion of youth that fell into the quadrants changed when looking at the five subgroups (Chart 6‑1).
Chart 6‑1: Quadrant Segmentation of Subgroups

Legend
High motivation, few access barriers
High motivation, many access barriers
Low motivation, many access barriers
Low motivation, few access barriers
The difference between subgroups and the national average was readily seen by decreases in the proportion of subgroup youth in the high motivation with few access barriers quadrant (green) and increases in the proportion in the low motivation with many access barriers quadrant (red). Almost half (46%) of Aboriginal youth fell into the low motivation and many access barriers quadrant, the quadrant associated with the lowest voting participation (versus 18% falling into this quadrant for the national random sample). Youth with high motivation and many access barriers (yellow) represented about 20% of most groups, although a slightly higher proportion of ethnocultural and disabled youth fell into this quadrant.
6.3 The Number of Youth in Each Motivation and Access Quadrant
Using the proportions of youth in each quadrant and data available from Statistics Canada, the estimated size of the four quadrants within the Canadian population of youth, and within the youth populations of subgroups was calculated (Table 6‑1). The results are shown as ranges because:
- Youth who agreed to participate in the study were more likely to have voted, and likely had increased motivation, and decreased access barriers than youth in general.27 As such, the proportions of Canadian youth that could be classified into each quadrant could only be estimated.
- The total numbers (white row) were estimated from Statistics Canada data that did not align perfectly with the age group and subgroup definitions of the current study. In each case, youth populations were based on extrapolations of the available data.
Source: Statistics Canada Population Estimates for July 1, 2011, Statistics Canada 2006 Census, Participation and Activity Limitation Survey 2006, and Labour Force Information August 2011.
6.4 Cluster Analysis of Youth
Cluster analysis was used to explore the degree of homogeneity within the motivation and access quadrants. Cluster analysis is a statistical technique that places respondents into groups with others of similar scores. In this case, a cluster analysis was employed to group responding youth (from both national random and purposive samples) based on their scores on the motivation and access barriers indices.28 In this analysis five clusters provided the best segmentation. Chart 6‑2 shows the five clusters along the two indices. Further analysis was performed to indentify the characteristic of each cluster.29
Chart 6‑2: Cluster Segmentation of Canadian Youth
Description texte de Graphique 3-1
Clusters of youth are described below and summarized in Table 6‑2.
6.5 Interventions
Interventions with the potential to address motivation factors and access barriers for youth non-voters are summarized in Table 6‑3.
| Access Barriers | Potential Interventions |
|---|---|
| Process Knowledge: To increase knowledge | Review and revise communication strategies to ensure that they effectively reach youth non-voters to inform them about when and where to vote and the different ways of voting.
Review processes for distribution of VIC to better reach youth, especially mobile youth. Consider new ways of communicating information to youth to reach non-voters (see Section 6.6). Develop strategies to increase awareness of all voting methods to reduce the proportion of youth who do not vote as a result of their higher mobility, absence from their riding or busy schedules. |
| Personal Circumstances: To reduce the impacts of personal impediments by increasing the convenience and flexibility of the voting process | Make polling stations more "child friendly." Getting to the polling station was a barrier to voting for some, especially youth living in rural localities. Develop strategies to increase awareness of other ways of voting. Consider placing polling stations at locations likely to be frequented by youth subgroups e.g., in employment centres. |
| Administrative Barriers to Voting: To mitigate the actual or perceived barriers associated with the accessibility of the polling site or perceptions of the polling station | Review policy on provision of ID. Lack of ID formed a significant barrier for many non-voters, and this suggests that use of the VIC as ID is an option that should be extended to all voters.30 Mobility reduces the likelihood that youth receive a VIC. Failure to receive a VIC is associated with lower participation. Consider other methods of distributing the VIC in particular, electronic methods. |
6.6 Reaching Youth
Influencers, sources of information and use of the media and internet by youth were explored in the National Youth Survey. While a full analysis of effective channels for reaching youth was beyond the scope of the National Youth Survey, the survey provides a basis for Elections Canada to begin developing communications strategies to reach youth voters and non-voters.
6.6.1 Influencers
Studies of voting behaviour have emphasized three key reasons why people choose not to be politically active: because they cannot, because they do not want to be and because nobody asked. 31 Influencers have the potential to motivate youth to vote by providing reasons to vote, "asking" them to vote and telling them how to do so.
In this study, youth who voted identified the main people and groups who influenced their decision to vote as politicians in general (27%), family (21%), the media (15%) and friends and peers (11%). Youth who had not voted in the May 2011 general election were less likely to identify potential influencers. Within youth subgroups, the lack of family influencers was significantly associated with not voting for Aboriginal, ethnocultural and rural youth as well as youth with disabilities. In other words, a lack of influencers was associated with lower voting participation. Table 6.4 shows the influencers that were having less impact on the specific subgroups.
Social media campaigns like vote mobs were also used in the May 2011 general election to connect with young voters and mobilize youth.32 In this survey, 7% of youth voters and 5% of youth non-voters said that vote mobs had had at least some influence on their decision whether to vote or not.
6.6.2 Sources of Information
The main sources of information used by youth to find out about the election were television, media websites, blogs and other web sources.
6.6.4 The Media and the Internet
Of the national random sample, 59% of surveyed youth reported that they used the internet between one and four hours a day, 11% used it for more than four hours per day and 30% used it for less than one hour per day. This usage suggests that the internet has the potential to be an effective form of communication. Lower internet usage was associated with slightly lower voting rates (70% compared to 76%). Facebook was a key social networking site used by 87% of surveyed youth.
6.6.4 Strategies for Reaching Youth
Strategies for reaching youth are summarized in Table 6.5. Some strategies apply to all groups of youth, and others will be most effective if they target specific groups. Youth subgroups are clustered in some localities. Data from the census could be used to profile ridings to identify those with higher proportions of youth and the youth subgroups. This information could be compared with administrative data about youth voting turnout to identify the ridings with low participation rates. Targeted approaches based on the demographic profiles of youth in those ridings could then be developed.
While some strategies for reaching youth can be used directly by Elections Canada, there may also be a role for Elections Canada in providing information about the importance of, and effective ways of, reaching youth to politicians and political parties.
| Target Group | Strategies |
|---|---|
| All youth | Youth non-voters are more likely to have lower educational attainment. Therefore, all material must be provided in a format suitable for less-educated individuals. Increase use of electronic channels such as Facebook, blogs, e-mails and texts to smartphones. Social media campaigns e.g., the US YouTube video competition.33 Role models although not identified in this study as effective, role models are a common strategy used in advertising to youth. Encourage and provide opportunities for key influencers such as politicians to provide face-to-face contact with youth. |
| Unemployed youth | On-site contact with youth. Future marketing and communication efforts could be directed at sites where youth with lower educational levels can be found, including:
|
| Aboriginal youth | Lower rates of electoral participation were identified for youth living on reserve. Reasons are likely to include a combination of lower motivation to vote as well as access barriers, such as transport to the polling station. Continuing to engage with First Nations elders is important to develop strategies to increase electoral participation by First Nations youth. Aboriginal youth were more likely to attend community meetings and gatherings, and communication through these meetings is likely to be an effective way of reaching Aboriginal youth. |
| Ethnocultural youth | Ethnocultural non-voters face barriers arising from the lack of process knowledge, compounded by the fact that they were less likely to receive a VIC. Information targeted to these groups describing when to vote and the different ways of voting may be of benefit. Strategies for reaching ethnocultural youth include ensuring that material is culturally appropriate. Since transportation issues were also a significant barrier to ethnocultural youth, operating polling stations in convenient locations for ethnocultural groups may also enhance participation rates. |
| Youth with disabilities | Youth with disabilities can be reached through a number of groups and organizations for youth with disabilities. Information needs to be provided so that an individual's disability does not prevent him or her accessing the information. |
| Rural youth | Youth living in rural areas were similar to youth in general, and thus no targeted strategies are apparent from the results of the survey. |
25 Based in part on a study by the New Zealand Electoral Commission, at www.elections.org.nz/study/researchers/participation/youth-non-voters-qualitative-research-summary.html.
26 Colours are applied to this analysis for illustrative purposes. Green is applied due to its association with "go' and red with "stop". Yellow and orange are used as colours in-between the extremes.
27 As previously noted, the proportion of respondents to surveys that voted in an election is routinely larger than the observed voting behaviour of the population.
28 Cluster analysis creates a number of groups of like-scoring respondents, but the number of groups used in the analysis is user-defined. By testing different numbers of clusters, the user can decide upon the number of clusters that seem to best segment the sample. For this analysis, cluster analysis was employed to create three, four, five and six clusters. By examining the resulting clusters, and how they identified logical segments, it was determined that five clusters provided the best segmentation.
29 Cluster analysis used the full sample (both national random and purposive samples), which includes oversamples of groups known to have motivation and access barriers to voting. As a result, ranges will be applied when extrapolating results from the National Youth Survey to the Canadian population of youth.
30 Elections Canada does not make up the core requirements of the ID policy, which are set by legislation and therefore can only be amended by Parliament.
31 Verba, S., K. Schlozman and H. Brady. Voice and Equality: Civic Voluntarism in American Politics. 1995. Cambridge, Mass.: Harvard University Press.
32 At www.greenconduct.com/news/2011/04/30/social-media-is-mobilizing-the-youth-vote-in-the-canadian-general-election/.
33 In the United States, celebrities and youth groups joined together to create the "Vote Again 2010" campaign, with the aim of increasing voter turnout for the mid-term elections. The campaign used social media and developed a competition to create the best YouTube video about getting involved in the political process.