 Site Menu
The National Youth Election Survey Report: A Subgroup Analysis of Political and Civic Participation among Canadian Youth
2. Youth Participation in the 2015 Federal Election
This section portrays the big picture of youth political and civic participation in 2015. In particular, it aims to answer the following questions:
- How much do Canadian youth participate in politics and civil society?
- Are there any substantial inequalities among youth subgroups in terms of participation?
We study three types of participation. First, we operationalize electoral participation as whether or not respondents self-reported voting in the October 2015 federal election.Footnote 1 Second, we include a measure of non-electoral political participation that we define as self-reported behaviours besides voting that signal an expression of political preference to political actors.Footnote 2 This measure allows us to capture whether respondents have reported engaging in at least one form of such political behaviour in the past year.Footnote 3 Finally, to contrast different forms of participation, we include a dichotomous measure of civic engagement, which we operationalize as whether respondents reported volunteering or having attended a community meeting about a local issue in the past 12 months.
We show that the participation of younger citizens lags behind that of their older counterparts when it comes to turning up on election day, but not with respect to other forms of political and civic participation. As regards the comparison among the youth subgroups, only the unemployed and rural youth are substantially less involved, on average, than the rest of Canada's young citizens. Conversely, in stark contrast with the 2011 federal election, Aboriginal youth reported voting in 2015 to the same extent as non-Aboriginal youth.
2.1 How Much Participation?
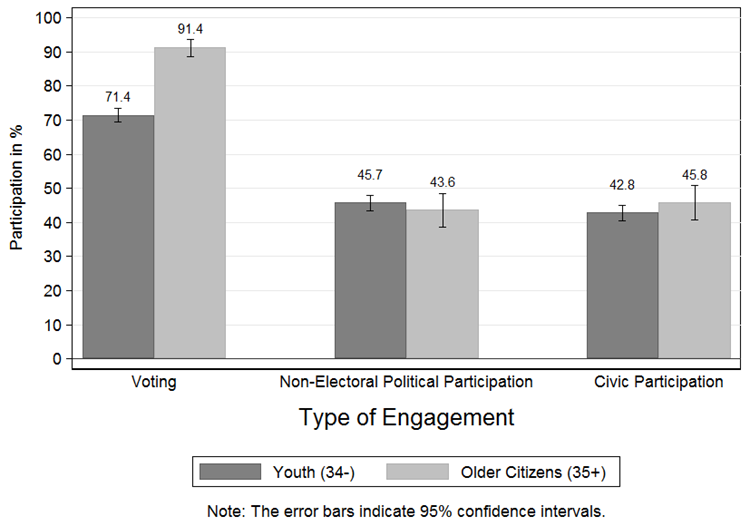
To what extent do youth participate in political and civic life? Figure 1 compares the self-reported participation rates of young Canadians (18–34 years of age) to those of their older counterparts following the 2015 federal election.Footnote 4 The results are consistent with the findings from earlier studies on youth political engagement in Canada (Barnes & Virgint, 2010; Blais & Loewen, 2011; Gélineau, 2013; Howe, 2007). On the one hand, youth self-reported voter turnout is approximately 20 percentage points lower than that of older adults. On the other, there is no statistically significant difference in terms of broader participation in politics and civic life. Canadian youth are as likely as older adults to have reported taking part in at least one form of political participation, and to have reported volunteering or attending meetings on local issues to a similar extent as older adults in the past year.Footnote 5 In short, while Canadian youth report comparable levels of civic and non-electoral political participation as older adults, they tend to vote less than older Canadians.
Figure 1. Rates of Civic and Political Participation by Age Group
Long Description of Figure 1. Rates of Civic and Political Participation by Age Group
2.2 Who Participates?
Our next question is to assess whether Canadian youth participate equally in political and civic life, or if there are noticeable disparities across youth from different backgrounds. Table 1 examines the proportion of young Canadians who reported voting and participating in other forms of political and civic activities across different subgroups.
We find that self-reported turnout is highest among young Canadians who are between 23 and 29 years of age and that as a group, students are much more active in all forms of participation than other subgroups of young adults. The former finding is surprising since, according to some studies (e.g., Bhatti, Hansen, & Wass, 2012), corroborated by findings from the 2011 NYS (Gélineau, 2013, p. 6), the propensity to vote is expected to be the lowest for youth in their early- to mid-20s. With respect to self-identified Aboriginal respondents, our results contrast markedly with reported levels of Aboriginal youth turnout in the 2011 federal election. Findings from the 2011 NYS showed that Aboriginal youth were half as likely as non-Aboriginals to report voting (see Gélineau, 2013, p. 7). In contrast, we find no evidence to suggest that Aboriginal youth were less likely to vote than their non-Aboriginal counterparts in 2015 – Aboriginal youth in our sample self-reported voting to the same extent as the national average of young adults.Footnote 6 Moreover, Aboriginal youth also reported greater levels of non-electoral political and, in particular, civic participation.Footnote 7
| Voting | Non-electoral political participation | Civic participation | |
|---|---|---|---|
| Youth (all) | 71.4 | 45.7 | 42.8 |
| Age Group | |||
| (18–22) | 66.3 | 46.4 | 51.3 |
| (23–29) | 77.8 | 49.7 | 43.5 |
| (30–34) | 67.3 | 39.3 | 33.7 |
| Gender | |||
| Male | 72.1 | 43.9 | 39.7 |
| Female | 70.8 | 47.5 | 46 |
| Residency | |||
| Urban | 72.8 | 48.1 | 44.7 |
| Rural | 68 | 38.5 | 42.6 |
| Student Status | |||
| Students | 76.1 | 51.5 | 53.6 |
| Non-students | 68.8 | 43.3 | 36.1 |
| Employment Status | |||
| Employed or not seeking employment | 72.5 | 46.4 | 43.5 |
| Unemployed | 46.9 | 32.7 | 27.6 |
| Disability Status | |||
| No disability | 71.6 | 45 | 49.2 |
| Self-reported disability | 70.3 | 60.7 | 42.6 |
| Aboriginal Status | |||
| Aboriginal | 70.1 | 51.2 | 51.1 |
| Non-Aboriginal | 71.6 | 45.5 | 42.6 |
| Visible Minority | |||
| Visible minority | 69.6 | 48.5 | 46.2 |
| Other | 73 | 45.6 | 42 |
| Place of Birth | |||
| Born abroad | 67.8 | 45.8 | 41.5 |
| Born in Canada | 71.9 | 45.8 | 43 |
| First Language | |||
| English | 71.3 | 46.4 | 45.1 |
| French | 72.9 | 45.1 | 34.1 |
| Other language | 68.8 | 43.3 | 45 |
| Region | |||
| Atlantic | 76.9 | 49.6 | 53.8 |
| Quebec | 71.2 | 46 | 33.5 |
| Ontario | 69.1 | 48 | 44.3 |
| Prairies | 76.7 | 40 | 48.7 |
| Alberta | 68.9 | 40.4 | 45 |
| BC/Territories | 75.9 | 44.8 | 43.4 |
Overall, while youth participate less than older adults at the ballot box, there are a few notable differences in self-reported participation across subgroups of youth. As mentioned, youth in their late 20s reported turning out in greater numbers than their younger or older counterparts under the age of 35. The only other notable differences are found for unemployed youth and youth living in rural areas, who are less likely to have reported voting.Footnote 8 In what follows, we extend our analysis to further explore these findings in greater detail to gain additional insights regarding the differences in the factors that drive youth participation in Canada across youth subgroups.
Return to source of Footnote 1 Self-reported voter turnout in public opinion surveys is typically higher than official voter turnout because of self-selection (those who vote are typically more willing to participate in a survey on voting) and social desirability (reporting abstention could be potentially embarrassing to the respondent). Nevertheless, the existing research shows that the relationships observed in the study of self-reported voter turnout largely hold when voter turnout that is validated against official or other sources (see Brady, Verba & Schlozman, 1995, p. 292; Highton 2005).
Return to source of Footnote 2 In some political science studies, "electoral participation" is a broad category that, besides voting, also encompasses party activities such as attending party meetings or canvassing. In the present report, this term refers exclusively to respondents' reports of casting a ballot in the 2015 federal election. In contrast, "non-electoral political participation" corresponds here to all other types of political behaviour, including party activities, some of which may occur during the election time. Specifically, we consider the following five political behaviours: contacting a politician regarding an issue, participating in a demonstration or protest march, displaying a sign for a party or candidate during an election, signing a petition, or participating in an event organised by a candidate or political party. A finer subdivision of "non-electoral political participation" is not used in most sections of this report, because of space constraints. This being said, in Section 3.2, we compare youth and older citizens' participation levels on each of the five aforementioned political behaviours.
Return to source of Footnote 3 For the ease of interpretation and given that, on average, respondents took part in less than one of the participatory behaviours considered here, we dichotomized this measure in our analyses reported below. Respondents who have reported participating in at least one non-electoral political behaviour are given a score 1, while those who reported not engaging in any of these behaviours are scored as 0. Dichotomizing our non-electoral participation variable has no impact on our main findings (see footnote 5).
Return to source of Footnote 4 For a formal statistical test of the differences between youth and older citizens, see Appendix Table 4.
Return to source of Footnote 5 This null finding between youth and older citizens holds even when the different types of participatory behaviours are summed in a cumulative index of political participation. Both groups participate on average in approximately 0.75 political acts.
Return to source of Footnote 6 Caution should be exercised in generalizing to Aboriginals living on reserve. There is only a small number of them in the 2015 NYS and living on a reserve has been associated with lower levels of reported voter turnout (see Fournier & Loewen, 2011). This notwithstanding, although the 2015 NYS wave contains fewer on-reserve Aboriginal youth respondents compared to the 2011 wave, the share of on-reserve Aboriginal respondents in our analysis are similar to those reported in the 2011 NYS after weighting (approximately 15% of Aboriginal respondents). Therefore, our finding of an increase in overall Aboriginal youth participation cannot be attributed to an underrepresentation of on-reserve Aboriginal youth in the 2015 NYS.
Return to source of Footnote 7 As Section 4.3 below demonstrates, the difference in terms of civic participation is statistically significant (p < 0.05).
Return to source of Footnote 8 In terms of voting, ethno-cultural youth (visible minorities and those born outside Canada) also seem to be slightly underrepresented (by 4 percentage points when compared to the rest of the Canadian youth). However, this effect is not statistically significant (p > 0.05) when subject to a formal statistical test; thus we conclude there are no substantial differences in self-reported voter turnout between visible minority youth and other younger adults.