Public Opinion Survey Following the November 26, 2012 By-Elections
2. Findings
2.1 Awareness of By-Elections
a) Overall Awareness
Overall awareness of the November 26, 2012 by-elections was very high. Nine in ten electors overall (90 per cent) were aware that an election took place in their riding on that date. Awareness was higher in Victoria and Durham (95 and 94 per cent, respectively) and significantly lower, although still more than eight in ten, in Calgary Centre (83 per cent).
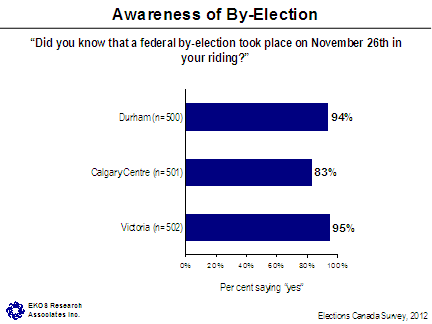
Text version of "Awareness of By-Election"
- Younger voters are typically less aware of a by-election: 80 per cent of 18 to 34 year olds, compared to more than nine in ten electors 35 years and older.
b) Sources of Information about the By-Elections
Newspapers, television and radio were the most commonly cited sources of information about the by-elections. Almost half of electors overall heard about the by-elections through newspapers (48 per cent), followed by 38 per cent who were made aware through television and 30 per cent through radio. Of sources specific to Elections Canada, the Voter Information Card was the most widely cited. Nearly one in five electors overall heard about a by-election by having received a voter information card in the mail (18 per cent), and a further ten per cent overall were made aware of a by-election because they received the EC householder brochure in the mail. One per cent report having heard about the by-election through the EC website. Around one in five electors heard about the by-election through candidates and parties elections signs (15 per cent) or signs and posters in their local area (three per cent). Some heard through word of mouth (10 per cent). The Internet (aside from the Elections Canada website) was a source for around one in ten, when taking account of websites (seven per cent) and social media (three per cent). Two per cent of electors heard about the by-election through telephone calls (from candidates, parties, and third party surveys). One per cent overall report having heard about the by-election through the news media (general), door-to-door canvassing visits, directly from political parties or candidates, working in the election (for EC or a party), and through the mail (flyers, pamphlets, etc. not specified as the EC householder).
Newspapers are more likely to have been a source for electors in Durham (56 per cent) and least likely in Calgary Centre (37 per cent). Television stands out more prominently in Calgary Centre (47 per cent, versus 32 per cent in Durham and 35 per cent in Victoria). Electors in Victoria are somewhat more likely to have cited radio as their information source (34 per cent, versus 30 per cent in Calgary Centre and 25 per cent in Durham).
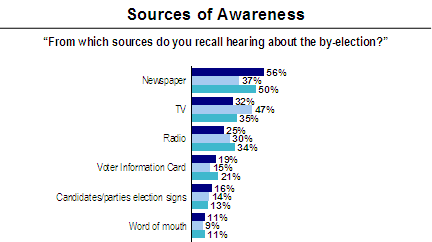
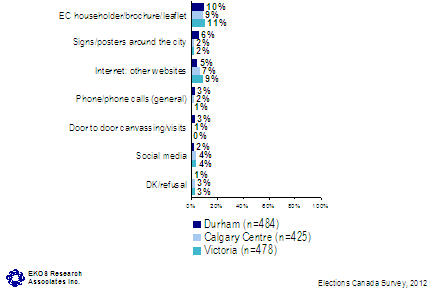
Text version of "Sources of Awareness"
- Newspaper and television are more likely to have been sources of information among older electors (57 per cent of those 55 and older heard about the by-election through the newspaper, compared to 32 per cent under 35). Forty-one per cent of electors ages 55 and older heard about the by-election from TV, compared to 35 to 36 per cent of younger voters.
- Seventeen per cent of electors under 35 heard about the by-elections through word of mouth, compared to about eight per cent of older electors. Younger electors are also slightly more likely to report having heard about the election through websites (11 per cent) and social media (six per cent).
- Women (13 per cent) are somewhat more likely than men (eight per cent) to have cited the Elections Canada householder.
- Electors from middle-income households ($40,000 to $80,000) are more likely to have cited the Voter Information Card (24 per cent, compared to 20 per cent with incomes under $40,000 and 15 per cent with incomes over $80,000). Electors from lower income households are less likely than average to have heard about the election through newspapers (41 per cent).
- Electors who are not employed are slightly more likely (21 per cent) to have heard about the by-election by word of mouth, but less likely (28 per cent) to cite TV as the source.
2.2 Voter Information
a) Voting Procedures
Electors were asked from what sources they got information about voting procedures such as where and when to vote and what was needed to prove their identity and address in order to vote. Overall, Elections Canada materials were mentioned by most electors (84 per cent in Durham and Victoria, while 73 per cent in Calgary Centre) and the majority learned about the voting procedures from their VIC. Electors in Durham are more likely to have gotten information from their VIC (68 per cent), followed by 66 per cent of voters in Victoria and 55 per cent in Calgary Centre. A further 16 per cent found out through another Elections Canada source such as the householder (9 to 11 per cent), the EC website (1 to 5 per cent), a local EC office (one per cent), or a general EC source (1 to 3 per cent). One in five found out through media like newspapers (9 to 13 per cent), radio (3 to 6 per cent), and television (3 to 6 per cent). Some heard about the voting procedures through family, friends or others (3 to 4 per cent), and from political parties or candidates (2 to 4 per cent) or campaigns (one per cent). Around one in ten learned from previous experience or knowledge (4 to 7 per cent), previous elections (1 to 3 per cent), or when voting (one per cent). A few others reported less specific sources, such as other pamphlets/brochures (1 to 3 per cent), the Internet or a website (1 to 4 per cent), or by phoning a 1-800 number (one per cent). Three to seven per cent did not get information from any source or did not intend to vote, while four to eight per cent did not know or can't remember where they got their information.
The proportions of electors who got information about voting procedures through other means are similar to the average across the three ridings.
| Where did you get information on voting procedures for this by-election? By that I mean, when and where to vote and how to prove your identity and address before voting*. | Durham | Calgary Centre | Victoria |
|---|---|---|---|
| Total: | 484 | 425 | 478 |
| Voter information card | 68% | 55% | 66% |
| Newspapers | 13% | 9% | 11% |
| EC householder - brochure / leaflet / reminder card (received in the mail) | 11% | 9% | 9% |
| Previous experience | 5% | 4% | 7% |
| Radio | 3% | 5% | 6% |
| Television | 3% | 6% | 5% |
| Friends/family/parents | 3% | 4% | 3% |
| Previous elections | 3% | 3% | 1% |
| Political parties/candidates | 2% | 4% | 2% |
| Telephone (EC 1- 800 number) | 1% | 1% | 1% |
| Other pamphlets/brochures | 1% | 3% | 1% |
| Internet/Web site | 1% | 4% | 3% |
| Elections Canada Web site | 1% | 5% | 3% |
| Elections Canada (general) | 1% | 1% | 3% |
| Local Elections Canada office in the electoral district | 1% | 1% | 1% |
| At the polling station, when voting | 1% | 1% | 1% |
| Campaigns | 1% | 1% | 1% |
| Social media (Facebook, Twitter, etc) | 0% | 0% | 1% |
| Other | 1% | 2% | 1% |
| None/Did not intend to vote | 3% | 7% | 3% |
| Don't know/Refusal | 4% | 8% | 5% |
*Up to three responses accepted among those aware of the by-election in their electoral district.
- Younger electors are more likely than the average to have gotten information from the EC website, although the incidence is fairly small (seven per cent).
- Electors between ages 35 and 54 are more likely to have gotten information on the voting procedure from their VIC (67 per cent, compared to 65 per cent of electors age 55 and older, and 55 per cent of electors ages 18 to 34).
- Electors 55 and older and retired voters are more likely than the average to have gotten information on voting procedure from newspapers (17 per cent each).
- Lower income electors are more likely than the average to have heard about the voting procedures through the EC householder (15 per cent).
- Middle income electors are more likely than others to have found out about the voting procedures through a VIC (70 per cent).
- Electors who are not employed are less likely than others to have found out about the voting procedure from their VIC (54 per cent).
b) Elections Canada Advertisement
Electors were asked if they recalled seeing or hearing any Elections Canada advertising about the by-election. In Durham, 41 per cent of electors recall seeing or hearing Elections Canada advertising about the by-election; 36 per cent in Victoria recalled this advertising and 32 per cent in Calgary Centre recalled it.
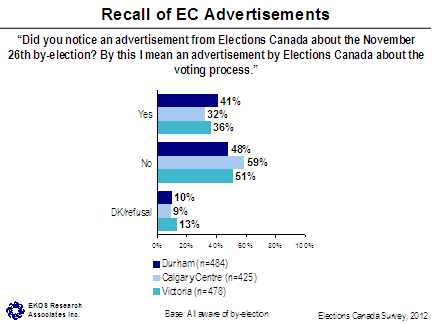
Text version of "Recall of EC Advertisements"
- Voters age 55 and older, as well as those who are retired, are more likely to have noticed advertising from Elections Canada about the by-elections (42 per cent, compared to 32 per cent of those under 35 and 35 per cent of 35 to 54 year olds).
c) Advertisement Sources
Electors who noticed this advertising from Elections Canada most often saw it in newspapers. In Victoria, 53 per cent of electors noticed the advertising in newspapers, compared to 50 per cent in Durham and 34 per cent in Calgary Centre. More than a quarter recall hearing an ad from Elections Canada on the radio (15 to 18 per cent) or on television (10 per cent in Durham and Victoria, and 15 per cent in Calgary Centre)Footnote 4. Some also mentioned their VIC, or the EC householder (6 to 9 per cent) as the source of the advertising. Electors in Calgary Centre are more likely to have reported the voter information card as advertising (15 per cent, compared to nine per cent in Victoria and six per cent in Durham). A few mentioned seeing advertising in pamphlets or brochures (4 to 5 per cent), and some mentioned receiving mail generally (1 to 2 per cent). Some saw posters and signs around their area (2 to 4 per cent), the Elections Canada website (up to 3 per cent) or the EC office in their electoral district (1 or 2 per cent). Between 15 and 19 per cent do not recall where they saw or heard the advertising from Elections Canada.
| Where did you notice advertising by Elections Canada about the by-election*? | Durham | Calgary Centre | Victoria |
|---|---|---|---|
| Total: | 260 | 178 | 241 |
| Newspapers | 50% | 34% | 53% |
| Radio | 16% | 18% | 15% |
| Television | 10% | 15% | 10% |
| EC householder - brochure / leaflet / reminder card (received in the mail) | 9% | 6% | 6% |
| Voter information card | 6% | 15% | 9% |
| Pamphlets/brochures | 4% | 5% | 4% |
| Signs/posters around area | 4% | 3% | 2% |
| 2% | 1% | 2% | |
| Local Elections Canada office in the electoral district | 2% | 1% | 1% |
| Elections Canada Web site | 1% | 3% | 0% |
| Other | 2% | 4% | 2% |
| Don't know/Refusal | 15% | 18% | 19% |
*Up to three responses accepted among those aware of the by-election in their electoral district
- Younger electors are more likely than older electors to have noticed advertising on the radio (31 per cent, compared to 15 per cent of 35 to 54 year olds and 11 per cent of those 55 and older).
- Older electors (58 per cent) and retired electors (56 per cent) are more likely to have noticed newspaper advertising than their counterparts.
- Men are more likely to have noticed radio advertising (21 per cent, compared to 12 per cent of women).
- Though the incidence is quite small, electors who are not employed are more likely to have noticed advertising on the Elections Canada website and at an EC office (six per cent each, compared to the average of one per cent).
- Lower income electors are more likely than average to have mentioned the VIC (16 per cent).
d) Content Recall
Electors who noticed some advertising were asked to recall what the main message talked about in the advertisement. One-quarter recall the advertising mentioned the date of the election; a further four to seven per cent recall information on the advance polling dates. Electors in Durham are more likely to have recalled a message about the date of the election (29 per cent, compared to 22 per cent in Calgary Centre and 23 per cent in Victoria). And two to three per cent recall a notice of the upcoming by-election. Just over one in five (20 to 23 per cent) recall a reminder to go vote and a further nine per cent indicate the message was an enticement to vote in Durham and Calgary Centre, although this is only two per cent in Victoria. One in ten (nine to 10 per cent) recall information about voters needing to prove their identity and address in order to vote in Durham and Calgary Centre, although this rises to 14 per cent in Victoria. Some remember seeing or hearing specific information such as the hours of the polling stations (8 to 10 per cent), a telephone number (3 per cent), where to go to vote (3 to 4 per cent), or the EC website (one per cent). A few recall messages about ways to vote, including how to vote (instructions, eligibility – 1 to 2 per cent), special voting rules (up to 2 per cent) and voting by mail (one per cent), and voting at a local EC office (1 to 3 per cent). Two to three per cent recall a reminder that they would get a VIC in the mail. Roughly two in five (36 to 41 per cent) do not recall what the advertising talked about.
| What did the advertising talk about*? | Durham | Calgary Centre | Victoria |
|---|---|---|---|
| Total: | 260 | 178 | 241 |
| Election date | 29% | 22% | 23% |
| Reminder to vote | 23% | 20% | 22% |
| Voters must prove their ID/address before voting | 10% | 9% | 14% |
| Enticement to vote | 9% | 9% | 2% |
| Advanced polling dates | 7% | 4% | 7% |
| Polling stations' opening hours | 8% | 10% | 10% |
| Candidates'/parties' platforms and ridings | 6% | 4% | 4% |
| Where to go vote | 4% | 4% | 3% |
| Telephone number | 3% | 3% | 3% |
| Voting at the local Elections Canada office | 3% | 1% | 3% |
| Reminder that a VIC will come in the mail | 3% | 2% | 2% |
| The upcoming by-election, what it is | 3% | 2% | 3% |
| Special Voting Rules | 2% | 0% | 1% |
| Voting by-mail | 1% | 0% | 1% |
| How to vote (instructions, requirements) | 1% | 2% | 3% |
| Website (elections.ca) | 0% | 1% | 2% |
| Other | 2% | 1% | 1% |
| Don't know/Refusal | 36% | 41% | 40% |
*Up to three responses accepted among those aware of the by-election in their electoral district
- Men are more likely to recall that the advertising included the election date (29 per cent, compared to 21 per cent of women).
- Higher income electors are more likely to recall that the advertising included the election date (32 per cent, compared to 16 per cent of those with incomes under $40,000 and 26 per cent of those with incomes between $40,000 and $80,000).
- Middle income electors are more likely than average to have noticed the dates of advance polls (10 per cent).
- Lower income electors are more likely to recall information about candidates' and parties' platforms (nine per cent).
- Though the incidence is quite small, electors who are not employed are more likely to have noticed information about special voting rules.
2.3 Interaction with Elections Canada
a) Attempts to Contact Elections Canada
Few electors contacted Elections Canada during the campaign, which was fairly similar across the three ridings (three per cent in Durham and five per cent in the other two ridings). Among those who did contact Elections Canada (n=59 across the three ridings), most said they got the information they needed, particularly in Victoria where virtually all respondents reported this to be the case. Just over one in ten said their questions were partially answered, although the concentration was higher in Durham. About one in ten said they did not get the information they needed, although the concentration was somewhat higher in Calgary Centre. Results should be interpreted with caution, however, given that these findings are based on 15 to 25 electors in each riding.
- Electors who are not employed are more likely to have contacted Elections Canada during the campaign (11 per cent, compared to three per cent of employed electors and four per cent of retired electors).
b) Calls from Elections Canada
Although Elections Canada does not call electors to inform them about where or when to vote during elections, roughly one in ten electors overall indicated, when asked, that they recalled having received a telephone call from Elections Canada during the campaign informing them about where and when to vote. This was highest in Durham, where 16 per cent indicated receiving such a phone call from Elections Canada. In Calgary Centre, 13 per cent say they received such a call, followed by seven per cent in Victoria. That said, it should be noted that the self-reported turnout among these electors is 68 per cent, which is a percentage not significantly different from the overall population.
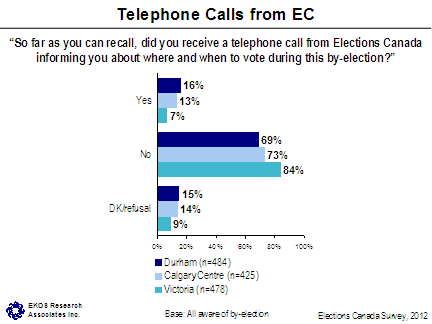
Text version of "Telephone Calls from EC"
2.4 Voter Information Card and Voter Registration
a) Recall of VIC
Electors' recall about having received a voter information card (VIC) addressed to them personally and informing them where and when to vote, was not entirely consistent across the three ridings. Electors who remember having received their VIC was highest in Durham (92 per cent) and lowest in Calgary Centre (69 per cent). In Victoria, 87 per cent recalled having received their VIC.
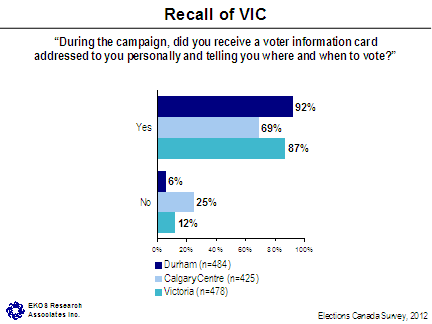
Text version of "Recall of VIC"
- Younger voters are least likely to report having received a voter information card: 65 per cent under the age of 35 say they received one (compared to 87 per cent or more of older electors).
- Retired electors are also more likely to have received a VIC (92 per cent), while those who are not employed are less likely to have received one (26 per cent).
b) Voter Registration
The majority of electors did nothing specific to find out whether they were registered to vote in the by-election (Durham, 82 per cent; Calgary Centre, 60 per cent; Victoria, 49 per cent). One in five found out at the polling station or at an Elections Canada office (significantly higher in Victoria at 30 per cent, compared to 12 per cent in Durham and 16 per cent in Calgary Centre). A few found out by visiting the Elections Canada website (Calgary Centre, 10 per cent and Victoria, 6 per cent, although it was zero in Durham) or calling the 1-800 number for Elections Canada (Durham, 2 per cent; Calgary Centre, 4 per cent; Victoria, 6 per cent). It is rare that electors found out about their registration by calling the phone number on someone else's VIC (one per cent overall), or through a revising agent at their home (one per cent overall).

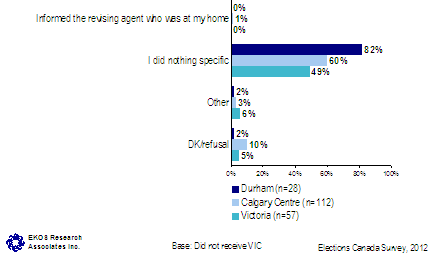
Text version of "Voter Registration"
- Though the incidence is quite small, electors ages 55 and older are more likely than the average to have called the telephone number on someone else's VIC.
- Retired voters are more likely than the average to have found out at the polling station or local EC office (33 per cent).
c) Accuracy of VIC
Of the electors who did receive a VIC in the mail, almost everyone indicated that their names were correct as written on the VIC (96 to 98 per cent). The addresses were correct for 98 to 99 per cent. Just over half (58 per cent) of those who encountered an error on their VIC (n=27) did something to correct the incorrect information on their card (Durham, 63 per cent; Calgary Centre, 51 per cent; Victoria, 56 per cent).
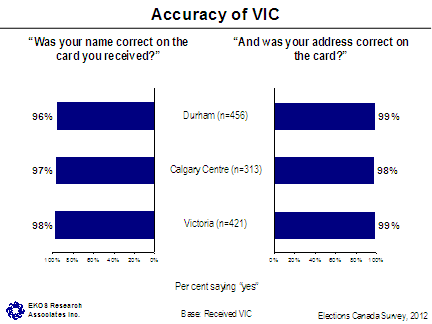
Text version of "Accuracy of VIC"
- There are no significant subgroup differences.
d) Recall of VIC Content
Nearly half of electors who received a VIC in the mail could not recall any specific information that was provided on the card other than information on where and when to vote (41 to 52 per cent). One in five recalled seeing information about advance polls (20 to 25 per cent). More than one in five recalled a message about identification: some recalled a notice that voters need to show identification at the polls (especially in Victoria at 24 per cent, while 10 and 14 per cent in Durham and Calgary Centre), four to seven per cent recalled reading that the VIC cannot be used as a piece of identification, and about one per cent recalled a message about what identification is acceptable. Just under one in five recalled their polling station number (15 to 20 per cent). One in ten recalled a message about where (four to six per cent) and/or when to vote (three to five per cent). Five to eight per cent recalled seeing a reminder or enticement to vote. A few electors recalled a message about what to do if information on the VIC is incorrect (one to three per cent), a telephone number (three to five per cent), information for voting by mail or special ballot (two to three per cent), the Elections Canada website (more so in Calgary Centre at four per cent, while one per cent or less elsewhere), information about candidates or parties (one to two per cent), and accessibility options for voting (one to two per cent). Other responses (one to two per cent) included messages about eligibility to vote.
| In addition to providing information about where and when to vote, what did the Voter Information Card talk about*? | Durham | Calgary Centre | Victoria |
|---|---|---|---|
| Total: | 456 | 313 | 421 |
| Information about advance polls | 20% | 20% | 25% |
| Polling station number | 17% | 20% | 15% |
| Voters need to show ID at the polls | 10% | 14% | 24% |
| Reminder/Enticement to vote | 8% | 5% | 6% |
| Where to vote | 6% | 4% | 4% |
| Voter Information Card cannot be used as an ID | 5% | 4% | 7% |
| When to vote (date and times) | 4% | 5% | 3% |
| Telephone number | 3% | 4% | 5% |
| Voting by mail/ at local Elections Canada office/ Special Voting Rules | 2% | 2% | 3% |
| Accessibility needs/disability requirements and options for voting | 2% | 0% | 1% |
| Candidates information, party representatives, who was running | 1% | 2% | 1% |
| What to do if information on the VIC is incorrect | 1% | 1% | 3% |
| Website (elections.ca) | 0% | 4% | 1% |
| What identification was acceptable to present/to bring | 0% | 0% | 1% |
| Other | 1% | 2% | 2% |
| Don't know/Refusal | 52% | 49% | 41% |
*Up to three responses accepted among those aware of the by-election in their electoral district
- Women are more likely to recall that electors need to show their identification at the polls (20 per cent, compared to 12 per cent of men).
- Middle-income electors are more likely than the average to recall advance polls (27 per cent, compared to 14 per cent with incomes under $40,000, and 21 per cent with incomes $80,000 and higher).
e) Voter Information Card Brought to Vote
Most voters took their VIC with them to vote (86 per cent overall). This was significantly higher in Durham (92 per cent), compared to 86 per cent in Victoria and 79 per cent in Calgary Centre.
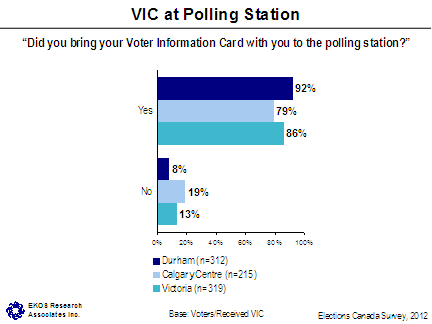
Text version of "VIC at Polling Station"
- Retired voters were more likely (90 per cent) than the average to have brought their VIC with them to vote.
2.5 Voting in the By-Election
a) By-Election
As in previous post-election surveys, there is a higher proportion of respondents who claim to have voted in the by-election compared to the actual voter turnout rateFootnote 5 in the ridings. In Durham, 65 per cent of respondents say they voted in the by-election, compared to the actual voter turnout rate of 36 per cent. In Calgary Centre, 48 per cent say they voted in the by-election, compared to the voter turnout rate of 29 per cent. In Victoria, 72 per cent say they voted in the by-election, compared to the voter turnout rate of 44 per cent.
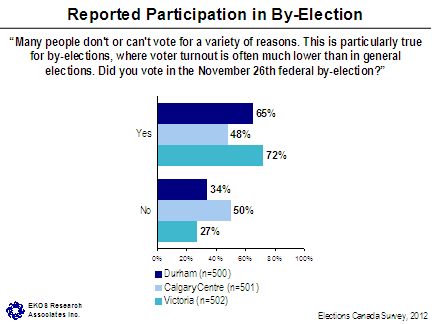
Text version of "Reported Participation in By-Election"
- Reported participation is higher among older Canadians: 76 per cent among electors 55 and older, compared with 43 per cent of electors under 35 and 61 per cent of electors between 35 and 54.
- Reported participation is also higher among men (64 versus 59 per cent among women).
b) 2011 General Election
Asked if they voted in the May 2, 2011 federal general election, the reported participation rate is 84 per cent overall, compared to actual voter turnout of 61 per cent.Footnote 6 This is highest in Victoria (92 per cent), followed by Durham (84 per cent), and Calgary Centre (78 per cent).
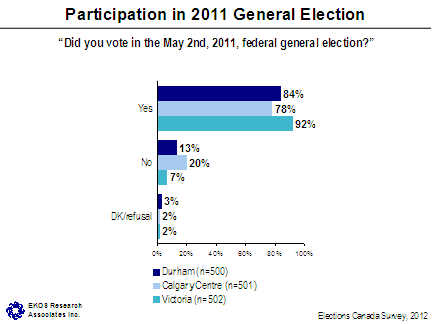
Text version of "Participation in 2011 General Election"
- Seven in ten of the electors reporting participation in the 2011 general election said that they also voted in the by-election, although 30 per cent said that they did not vote in the by-election. Of those who did not vote in the general election 86 per cent also did not vote in the by-election (although 14 per cent said that they did).
- The participation pattern is similar to that of the by-election with regard to age and retirement. Electors age 55 and older and retired electors are more likely than the average to say they voted (94 per cent each).
- Voters under age 35 are among the least likely to have voted (68 per cent).
- Lower income electors are also among the least likely to report that they voted (77 per cent of those with incomes under $40,000, compared to 88 per cent of those with incomes over $80,000), which is a pattern not found for the participation in the by-election.
c) Reasons for Not Voting in the By-Election
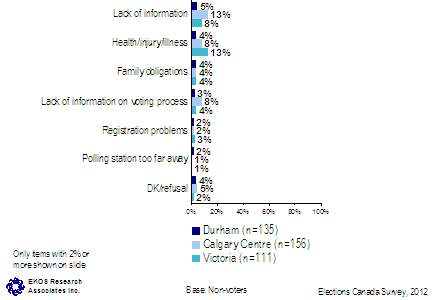
Non-voters were asked the main reason why they did not vote in the by-election.Footnote 7 The majority did not vote due to personal reasons, especially in Durham (75 per cent) and Victoria (74 per cent), and less often in Calgary Centre (76 per cent). Personal reasons for not voting include being too busy (16 to 25 per cent), travelling (being out of town, travelling abroad: 14 to 17 per cent), work (seven to 16 per cent), lack of information generally (five to 13 per cent), lack of interest/apathy (eight to 11 per cent), health issues, injuries or illness (particularly in Victoria, four to 13 per cent), transportation issues (one to two per cent), family obligations (4 per cent), and forgetting to vote (one to six per cent). Electors in Calgary Centre are more likely to point to a lack of information (13 per cent). Electors in Victoria are more likely to have cited illness, injury or health issues (13 per cent), and less likely to report work as a barrier (seven per cent) relative to the other two ridings.
More than one in ten cited issues having to do with the electoral process/procedures as reasons for not voting, especially electors in Calgary Centre (14 per cent), with smaller proportions reporting these issues in Victoria (17 per cent) and Durham (9 per cent). Reasons having to do with the electoral process include lack of information specifically related to the voting process (three to eight per cent), registration problems (two to three per cent), problems accessing the polls (one to two per cent), no documents to prove identification (about one per cent), and the polling station being too far away from home (one to two per cent).
Some non-voters said they did not vote due to political reasons, which was more often the reason for non-voters in Durham and Victoria (both 17 per cent) than for those in Calgary Centre (eight per cent). Political reasons for not voting are issues related to candidates (five to seven per cent), political parties (one to five per cent), and government and political parties (one per cent each); cynicism (about one per cent) and perceived meaninglessness of vote (one to seven per cent); and turning attention elsewhere (about one per cent). Although the incidence is quite small, electors in Durham are more likely to say they did not vote because of the perception that their vote is meaningless (seven per cent).
- Electors age 55 and older and retired electors are more likely to say that travel (22 per cent to 25 per cent) and health issues, injury or illness (13 to 24 per cent) were a barrier.
- Non-voters under the age of 35 are more likely than those who are older to mention family obligations (eight per cent) and lack of information (13 per cent) as the reasons why they did not vote.
- While employed electors were more apt to cite work as the reason for their non voting behaviour (15 per cent), those who are not employed were more apt than average to say they were too busy (37 per cent), had family obligations (12 per cent), registration problems (10 per cent), or transportation issues (seven per cent).
- For those in the lowest income brackets "too busy to vote" and health issues, injury or illness were more often cited as barriers (30 and 17 per cent, respectively).
- Middle income electors are more likely to say they lacked information (18 per cent).
- Higher income electors are more likely to say that travel was the reason for their non voting behaviour (20 per cent) or that they were not interested (14 per cent).

Text version of "Reasons for Not Voting"
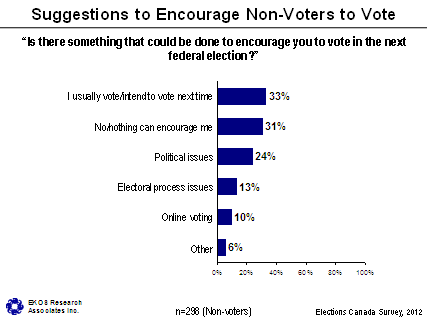
Non-voters were asked, as an open-ended question, whether anything in particular could be done to encourage them to vote in the next federal election. One-third of respondents (33 per cent) indicated that they usually vote and/or intend to vote in the next election; some of these respondents indicated something just "came up" that prevented them from voting this time. On the other end of the spectrum, three in ten non-voters (31 per cent) say there is nothing that can be done to encourage them to vote. One-quarter (24 per cent) mentioned political issues get in their way of voting; these respondents suggested things like better candidates and more/clearer information about candidates' and parties' platforms could get them to vote in the future. Issues about the electoral/voting process were brought up by 13 per cent, who suggested things like more time to vote and more information about how, where and when to vote could encourage them to vote next time. One in ten non-voters (10 per cent) said they would be encouraged to vote if online voting were an option. Six per cent mentioned other issues or suggestions.
Text version of "Suggestions to Encourage Non-Voters to Vote"
d) Reasons for Voting
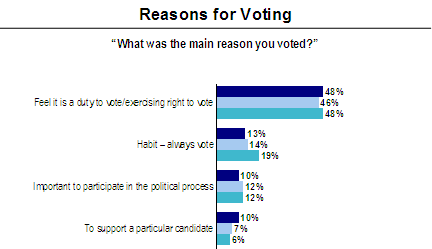
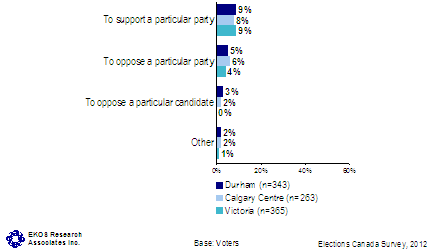
Among those who did vote, the main reason was centred on the sense of duty in exercising their right to vote (46 to 48 per cent in each of the ridings). Some said they vote out of habit (i.e. they always vote); higher in Victoria at 19 per cent, compared to 13 per cent in Durham and 14 per cent in Calgary Centre. One in ten overall (10 to 12 per cent in each riding) voted because they feel it is important to participate in the political process. One in four overall voted for specific political reasons, including to support or oppose a particular party (nine per cent and five per cent) and to support or oppose a particular candidate (eight per cent and two per cent).
Text version of "Reasons for Voting"
- Electors with incomes less than $40,000 are less likely than the average to have voted because they feel it is their duty to vote (40 per cent).
e) Online Voting
Three-quarters of respondents who did not vote say they would have or maybe would have voted had there been the option to vote online. Six to seven in ten said they would have (Durham, 59 per cent; Calgary Centre, 70 per cent; Victoria, 58 per cent), and one in ten said they might have voted with this option (Durham, nine per cent; Calgary Centre, eight per cent; Victoria, 18 per cent). One-quarter (24 per cent) said they would not have voted even if online voting had been an option.
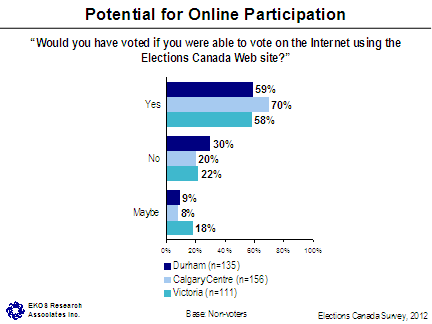
Text version of "Potential for Online Participation"
- Younger electors are more open to the possibility of voting online. Three-quarters of electors under the age of 35 (74 per cent) say they would have voted online (and ten per cent say they might have). This is compared to 64 per cent among those who are between 35 and 54 years old and 47 per cent of those who are 55 and older.
- Electors with lower incomes are slightly less likely (54 per cent) to say they would have voted if they could have done so online (compared with 66 per cent of those in the $40,000 to $60,000 range and 68 per cent of those with incomes greater than $80,000).
2.6 Voter Participation
a) Method of Voting
Most electors voted at a polling station on election day. This was highest in Durham (86 per cent) and lowest in Victoria (75 per cent), with Calgary Centre in the middle (81 per cent). Some voted at advance polls held November 16, 17 and 18, highest in Victoria (24 per cent), followed by Calgary Centre (15 per cent) and Durham (12 per cent). Only a few voted at a local Elections Canada office (one per cent overall). No one reported voting by mail.
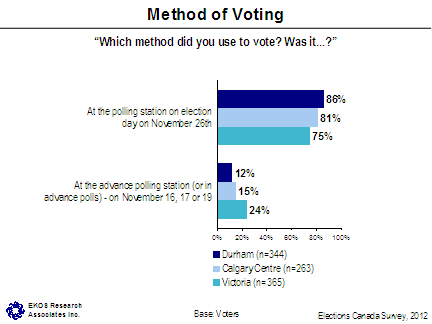
Text version of "Method of Voting"
- Voters aged 55 years and older are more likely to have voted at advance polls (22 per cent, compared to 11 per cent of 18 to 34 year olds and 14 per cent of 35 to 54 year olds). Similarly, retired electors are also more likely to have voted at the advance polls (23 per cent).
b) Awareness of Voting Options
Half of electors were not aware that it is possible to vote by mail at any time during a federal election (Durham, 50 per cent; Calgary Centre, 49 per cent; Victoria, 54 per cent).
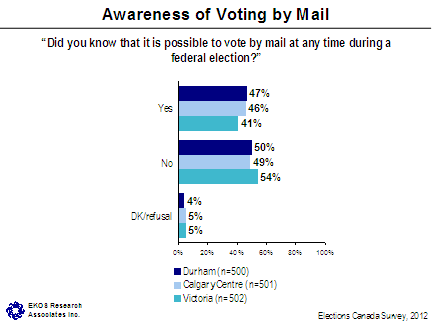
Text version of "Awareness of Voting by Mail"
- Awareness is slightly lower among women (53 per cent were not aware, compared to 48 per cent of men).
- It is also lower among employed electors (43 per cent aware), compared with retired electors (50 per cent).
c) Ease of Voting
Almost all voters thought that voting was easy. Most say it was very easy (Durham, 90 per cent; Calgary Centre, 86 per cent; Victoria, 88 per cent) and a few say it was somewhat easy (Durham, 9 per cent; Calgary Centre, 11 per cent; Victoria, 8 per cent). Only two per cent found it somewhat difficult and one per cent in Victoria found it very difficult.
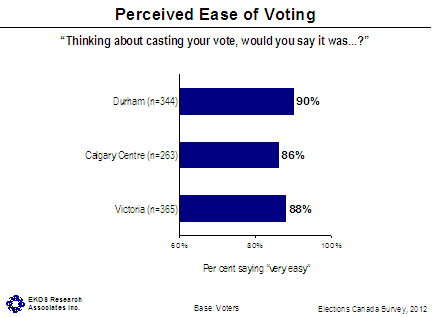
Text version of "Perceived Ease of Voting"
- There are no significant subgroup differences.
2.7 Proof of Identity/Address Requirements
a) Awareness of Requirements
Almost all electors were aware that they must present proof of identity in order to vote in a federal election (Durham, 96 per cent; Calgary Centre 97 per cent, Victoria, 99 per cent). Slightly fewer overall, but still the vast majority (91 to 92 per cent), were aware that proof of address must also be presented in order to vote in an election.
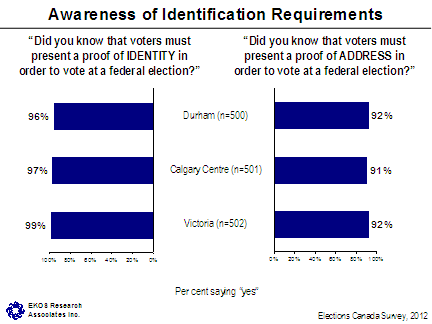
Text version of "Awareness of Identification Requirements"
- Awareness is slightly higher among electors age 55 and older (99 and 91 per cent).
b) Source of Awareness
In Victoria the largest proportion of electors became aware of the voter identification requirements as a result of receiving a VIC in the mail (43 per cent). The proportion was considerably lower in Durham and Calgary Centre where prior knowledge and the VIC were recalled as the source by similar proportions of electors. More specifically, 26 and 30 per cent of Calgary Centre and Durham electors pointed to the VIC as a source, respectively, compared with 31 per cent citing prior knowledge or experience in these ridings. Citing previous elections was also reported by one in four electors in Durham, and slightly less often in Calgary Centre (20 per cent) and Victoria (18 per cent). Other sources were cited considerably less often. Roughly five per cent learned through receiving the EC householder. Nearly one in five learned about these requirements through television (five per cent), newspapers (seven per cent) and radio (five per cent). Four per cent found out about these through Internet sources (including three per cent through the Elections Canada website). One in ten (nine per cent) learned about the requirements when they went to vote. Another one in ten heard about the requirements by word of mouth (seven per cent), work (two per cent), school (one per cent), or party candidates (one per cent).
| From what sources do you recall hearing about voter identification requirements? | Durham | Calgary Centre | Victoria |
|---|---|---|---|
| Total: | 493 | 493 | 498 |
| Experience/prior knowledge | 33% | 31% | 31% |
| Voter Information Card (received in the mail) | 30% | 26% | 43% |
| Previous election | 25% | 20% | 18% |
| When I voted | 11% | 9% | 7% |
| Newspaper | 7% | 7% | 7% |
| Word of mouth (friends, relatives, colleagues) | 7% | 9% | 6% |
| EC householder - brochure / leaflet / reminder card (received in the mail) | 4% | 6% | 5% |
| Radio | 3% | 5% | 6% |
| TV | 3% | 8% | 4% |
| Through work | 2% | 1% | 2% |
| Through school | 2% | 1% | 1% |
| Through candidates'/parties' campaigns | 1% | 1% | 1% |
| Elections Canada Website | 0% | 4% | 4% |
| Internet: other websites | 0% | 2% | 2% |
| Social media (Facebook, Twitter, etc.) | 0% | 1% | 1% |
| Other source | 2% | 1% | 1% |
| Don't know/Refusal | 5% | 7% | 7% |
- Electors age 55 and older and retired electors are more likely than the average to have heard about the requirements through receiving a VIC (37 per cent each) or newspaper (10 per cent).
- Electors under the age of 35 are more likely than the average to have learned about the requirements through word of mouth (18 per cent).
- Middle income electors are more likely than the average to have heard through receiving a VIC (41 per cent), and at the polling station (14 per cent).
- Electors who are not employed are more likely to have heard about the requirements by word of mouth (18 per cent) and through school (10 per cent).
c) Compliance with Identification Requirements
Virtually everyone who was aware of the proof of identification and address requirements and went to vote had the required documents with them. In Calgary Centre, four per cent did not have the required documents with them, while in both Durham and Victoria just one per cent was without the required documents.
Most electors feel that it is easy to meet the identification requirements to vote. Just two per cent say that requirements are difficult to meet in Victoria (one per cent in Calgary and none in Durham), while 98 per cent of the overall population feel that they are easy to meet, including nine in ten who feel the requirements are very easy to meet.
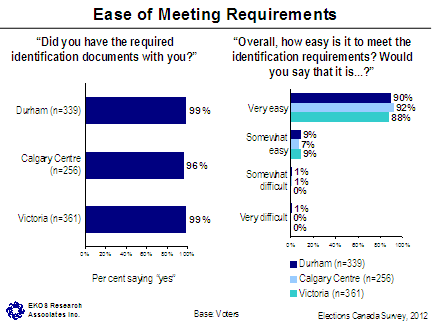
Text version of "Ease of Meeting Requirements"
- Though the incidences are very small (between four and five per cent), voters between 18 and 24 years old, those with incomes between $40,000 to $80,000, and those not employed are slightly more likely to have presented themselves at the polling station without the required documentation.
d) Documentation Presented to Vote
Most electors presented a driver's license as their proof of identity and address when they went to vote (93 per cent in Durham, 87 per cent in Calgary Centre and 88 per cent in Victoria).
Overall, when taking account of both the first and second responses, around 10 per cent of electors presented other documents, such as a Canadian passport (two to six per cent), health card (two to four per cent), Canadian citizenship card (two per cent in Calgary Centre, while none in the other ridings), utility bill (one to four per cent), or provincial or territorial identification card (two per cent in Calgary Centre and Victoria, none in Durham) as a form of documentation. Six to eight per cent presented a Voter Information Card as proof of identification. Of those who provided a Voter Identification Card, three in four also presented a driver's license.
| Which document did you use to prove your identity and address? 1st Response | Durham | Calgary Centre | Victoria |
|---|---|---|---|
| Total: | 338 | 250 | 357 |
| Driver's Licence | 91% | 86% | 85% |
| Health Card | 2% | 1% | 0% |
| Voter Information CardFootnote 8 | 2% | 3% | 2% |
| Canadian Passport | 1% | 2% | 4% |
| Provincial/Territorial Identification Card | 0% | 2% | 2% |
| Certificate of Canadian Citizenship (Citizenship Card) | 0% | 2% | 0% |
| Birth Certificate | 0% | 1% | 0% |
| Utility Bill (telephone, TV, public utilities commission, hydro, gas or water) | 0% | 1% | 2% |
| Other | 1% | 2% | 2% |
| DK/NR | 1% | 0% | 1% |
| Which document did you use to prove your identity and address? 2nd Response | Durham | Calgary Centre | Victoria |
|---|---|---|---|
| Total: | 82 | 51 | 87 |
| Voter Information Card | 23% | 16% | 19% |
| Health Card | 8% | 7% | 9% |
| Birth Certificate | 7% | 0% | 3% |
| Driver's Licence | 6% | 6% | 13% |
| Firearm Possession and Acquisition Licence or Possession Only Licence | 5% | 0% | 0% |
| Canadian Passport | 4% | 7% | 9% |
| Social Insurance Number Card | 2% | 3% | 1% |
| Certificate of Indian Status (Status Card) | 1% | 0% | 0% |
| Provincial/Territorial Identification Card | 1% | 0% | 0% |
| Hospital/Medical Clinic Card | 1% | 0% | 0% |
| Credit/Debit Card | 1% | 0% | 2% |
| Employee Card | 1% | 0% | 0% |
| Canadian Forces Identity Card | 1% | 0% | 0% |
| Fishing, Trapping or Hunting Licence | 1% | 0% | 0% |
| Utility Bill (telephone, TV, public utilities commission, hydro, gas or water) | 1% | 8% | 10% |
| Attestation of Residence issued by the responsible authority of a First Nations band or reserve | 1% | 0% | 0% |
| One of the following, issued by the responsible authority of a shelter, soup kitchen, student/senior residence, or long-term care facility: Attestation of Residence, Letter of Stay, Admission Form or Statement of Benefits | 1% | 2% | 0% |
| Parolee Identification Card | 1% | 0% | 1% |
| Bank/Credit Card Statement | 0% | 2% | 0% |
| Old Age Security Card | 0% | 0% | 1% |
| Other | 5% | 4% | 4% |
| None (not possible for 1st response) | 25% | 38% | 21% |
| DK/NR | 3% | 8% | 6% |
- A driver's license is more likely to have been presented by higher income electors (96 per cent) compared to the average.
- Lower income electors and those not employed are more likely to have presented Canadian passports, utility bills, Canadian citizenship cards, and provincial/territorial identification cards.
e) Missing Documentation
Those people without the required documentation (n=14) were asked which pieces of identification or documentation they were missing.Footnote 9 Among these, the largest number was missing documentation with their address (n=6), some were missing photo identification (n=3), and a few were missing documentation with their name (n=2). A few said, specifically, that they were missing their VIC (n=2), even though this specific item is not required to vote. Among these electors with missing documents, about one in four went back to find the missing documents (n=3), and all of these people say they voted. About one in five swore an oath with another registered elector (n=3). One person who did not have the required documentation reported that he did not vote.
2.8 Voting Experience
a) Polling Station Distance and Convenience
Among those who voted at a polling station on election day, most voters travelled from home to vote, which was most frequently the case in Victoria (81 per cent) and least so in Calgary (72 per cent). Some went from work to the polling station (13 to 19 per cent). A small proportion (five to seven per cent) arrived from another location. Among those who voted at the advance polling station, proportions who left from home, work, and other locations are nearly identical to those who voted on election day. Only a very small number (n=6) voted at an Elections Canada office; about three quarters of these people went there from home, while the remainder went there from work. Of the small number of people who voted in some other way (i.e. some way other than at the polling station on election day, at advanced polls, at an Elections Canada office or by mail; n=9), two in five departed from home, while half departed from a location other than home or work.
Virtually all electors found the distance to travel to vote to be convenient for them (Durham, 97 per cent; Calgary Centre, 96 per cent; Victoria, 99 per cent). Only a few (three per cent overall; n=24) had any difficulty reaching their polling station or EC office. Among these electors who experienced difficulties, 23 per cent encountered physical accessibility issuesFootnote 10, 13 per cent said that the polling station address was difficult to find, and 12 per cent found there was not enough parking space. A few (four per cent) encountered imprecise signage. Nearly two in five (39 per cent) had some other difficulty, such as traffic around the polling station or unexpected detours.
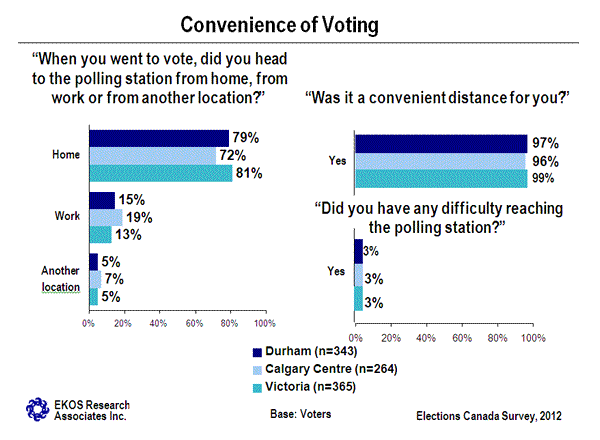
Text version of "Convenience of Voting"
- Electors age 55 and older (85 per cent) and retired electors (93 per cent) are more likely than the average to have travelled from home to vote.
- Electors between 35 and 54 are more likely than the average to have travelled from work to vote (21 per cent).
- Fittingly, employed electors are more likely to have travelled from work to vote (23 per cent). Lower income (11 per cent) and electors who are not employed (13 per cent) are more likely to have travelled from another location to vote (i.e., school).
- Electors reporting a disability were no more likely than other electors to report difficulty in reaching the polling station.
b) Language of Service
Almost everyone who voted was served in English (99 per cent). Everyone (100 per cent) was satisfied with the language in which they were served.
c) Waiting to Vote
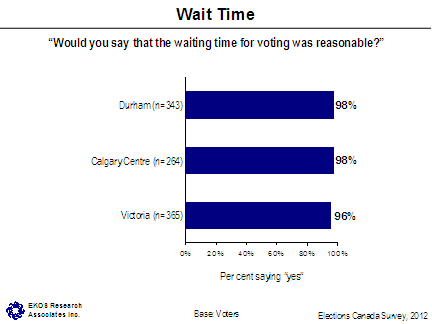
Nearly everyone was satisfied with the time spent waiting to vote at the polling station (96 and 98 per cent in each riding).
d) Assistance with Voting
One per cent of voters overall required assistance in order to cast their ballot (n=15). Among these voters, some required assistance from poll staff, a relative or friend. Among the 76 electors reporting a disability, ten per cent said that they needed special assistance in order to cast their ballot, accounting for half of the 15 individuals in the survey reporting the need for assistance.
e) Satisfaction with EC Staff
Overall, nine in ten voters were very satisfied with the services provided by EC staff when they voted (Durham, 92 per cent; Calgary Centre, 87 per cent; Victoria, 90 per cent). Just under one in ten were somewhat satisfied (Durham, six per cent; Calgary Centre, 11 per cent; Victoria, seven per cent). Only two per cent were not very or not at all satisfied (one per cent in each riding).
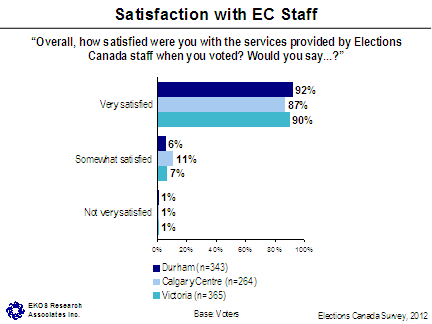
Text version of "Satisfaction with EC Staff"
f) Ease of Voting
Almost everyone says that it is very easy (Durham, 95 per cent, Calgary Centre, 90 per cent, Victoria, 91 per cent) or somewhat easy (Durham, four per cent, Calgary Centre, nine per cent, Victoria, six per cent) to cast a ballot in a federal election. Just one per cent says it is somewhat difficult, and no one says it is very difficult.
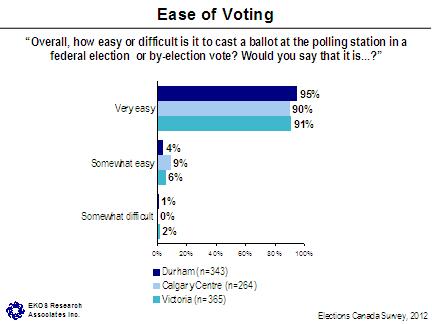
Text version of "Ease of Voting"
2.9 Accessibility
a) Building Accessibility and Signage
Nine in ten voters say that the building where they voted was very accessible and a further five to ten per cent found it somewhat accessible. In Durham, 95 per cent found the building to be very accessible; this is slightly higher than in Calgary Centre (90 per cent) and Victoria (89 per cent). Those saying the building was inaccessible (n=6) say they encountered physical accessibility issues, not enough parking space, imprecise signage, and traffic.
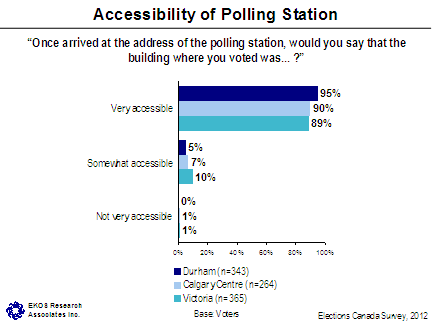
Text version of "Accessibility of Polling Station"
When asked whether there were enough directional signs outside of the building to help find the entrance to the polling station, most say the quantity of signs was sufficient, although just over one in ten indicated there were not enough (Durham, 10 per cent; Calgary Centre, nine per cent; Victoria, 15 per cent).
When asked whether there were enough directional signs inside the building to help find the way to the room for voting, almost everyone (96 to 97 per cent) says there were enough signs.
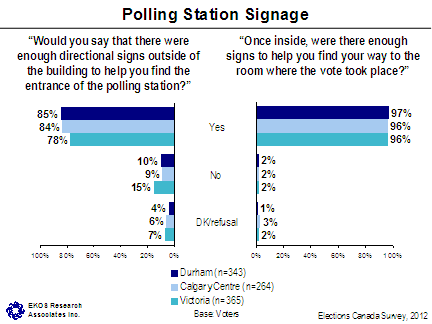
Text version of "Polling Station Signage"
- Younger voters are less likely than the average to have found the number of directional signs outside the building to be adequate (19 per cent said there were not enough signs). Though the incidence is very small, younger voters are also somewhat less apt to have found the quantity of indoor signs to be sufficient.
More than two in five electors noticed signs indicating the building where they went to vote had level access for wheelchairs. This was slightly higher in Durham, where 48 per cent noticed such signs, followed by 40 per cent in Victoria and 39 per cent in Calgary Centre. The majority of those who saw these signs say they were highly visible (67 to 72 per cent), and roughly one in five say they were somewhat visible. Just three per cent indicate they were not very visible.
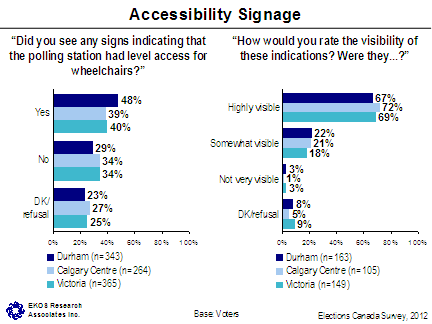
Text version of "Accessibility Signage"
- Employed electors are less likely (39 per cent) than the average to have noticed level access signs. Electors reporting a disability provided roughly similar ratings of the visibility of the signs relative to the rest of electors, with 65 per cent rating them as highly visible.
2.10 Perceptions of Fairness
The majority of electors perceive the by-election to have been run fairly by Elections Canada. Two-thirds overall say it was run very fairly, and a further 13 per cent say it was run somewhat fairly. Two per cent thought that Elections Canada ran the election somewhat unfairly and one per cent very unfairly, with an additional 16 per cent who did not know. As a reference point, it can be stated that these results are similar to that of the 2011 general elections, except for the percentage of electors who thought that the election was run somewhat fairly (25 per cent in 2011) and those who did not know (6 per cent in 2011). In Victoria, electors are more likely to say that the by-election was run very fairly (73 per cent), compared to 68 per cent in Durham and 61 per cent in Calgary Centre.
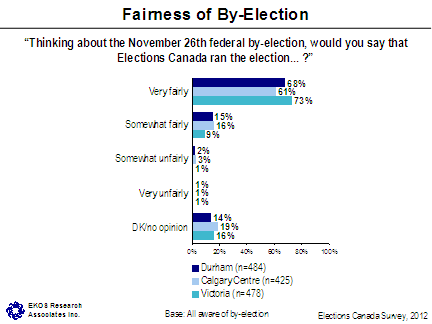
Text version of "Fairness of By-Election"
- Electors age 55 and older (77 per cent) and retired electors (75 per cent) are more likely than the average to say that the election was run very fairly compared with their counterparts.
2.11 Use of Technology
More than nine in ten access the Internet (92 per cent overall; Durham, 94 per cent; Calgary Centre, 91 per cent; Victoria, 92 per cent). Most access the Internet through a laptop computer (63 to 73 per cent) or a desktop computer (60 to 64 per cent). More than two in five electors use a smart phone to access the Internet (44 per cent overall) and nearly three in ten (29 per cent) use a tablet. Electors in Calgary Centre are more likely to use a smart phone (53 per cent laptop (73 per cent), or tablet (37 per cent) to access the Internet, compared to electors in Durham and Victoria.
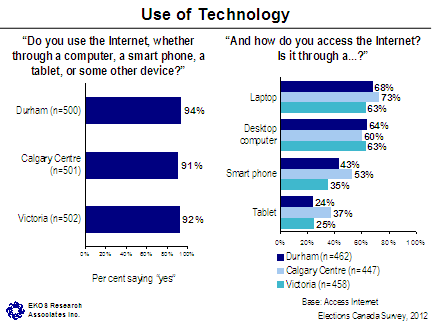
Text version of "Use of Technology"
- Higher income electors are more likely than the average to use any of these devices to access the Internet, although even among those reporting households' incomes of under $40,000, 80 per cent use the Internet.
- Older, particularly retired electors, are less likely to access the Internet (83 and 76 per cent, respectively).
- Employed electors are more likely than the average to use smart phones (51 per cent), laptops (73 per cent), and tablets (33 per cent). This is also true of younger electors (under 35 years of age): 65 per cent use smart phones, 79 per cent use laptops and 38 per cent use tablets. In fact, only 55 per cent of those under 35 access the internet from a desktop computer.
- Electors age 55 and older are more likely to use desktop computers than any other age group (67 per cent).
- Men are somewhat more likely than women to use smart phones, desktops, and tablets.
2.12 Socio-demographics
The table below provides socio-demographic details or respondents by each riding.
| Durham | Calgary Centre | Victoria | |
|---|---|---|---|
| Living with either or both parents at time of by-election (Base: voters between the ages of 18 and 35) | |||
| Total: | 71 | 117 | 53 |
| Yes | 38% | 24% | 30% |
| No | 62% | 76% | 70% |
| Don't know/Refusal | 0% | 0% | 0% |
| Ethnic background | |||
| Total: | 500 | 501 | 502 |
| White/Caucasian | 90% | 83% | 92% |
| Black | 1% | 2% | 1% |
| Latin American | 1% | 1% | 0% |
| West Asian/North African/Arabs | 1% | 1% | 0% |
| Aboriginal Canadian | 1% | 1% | 1% |
| Chinese | 0% | 2% | 1% |
| East Asia | 0% | 1% | 0% |
| South Asian/East Indian | 0% | 3% | 0% |
| Filipino | 0% | 1% | 0% |
| Other Visible Minorities | 2% | 3% | 2% |
| Don't know | 1% | 0% | 0% |
| Refusal | 2% | 2% | 2% |
| Country of birth | |||
| Total: | 500 | 501 | 502 |
| Canada | 89% | 83% | 82% |
| United Kingdom | 3% | 3% | 5% |
| United States | 1% | 1% | 3% |
| Germany | 1% | 0% | 1% |
| Poland | 0% | 1% | 0% |
| Hong Kong | 0% | 1% | 0% |
| India | 0% | 1% | 0% |
| Philippines | 0% | 1% | 0% |
| Other | 6% | 8% | 8% |
| Don't know/Refusal | 0% | 1% | 1% |
| Person with a disability | |||
| Total: | 500 | 501 | 502 |
| Yes | 5% | 8% | 12% |
| No | 95% | 91% | 88% |
| Don't know/Refusal | 0% | 1% | 1% |
| Nature of your disability | |||
| Total: | 26 | 41 | 65 |
| Mobility | 42% | 34% | 29% |
| Blind or visual impairment | 11% | 4% | 8% |
| Co-ordination or dexterity | 3% | 4% | 2% |
| Deaf or hard of hearing | 0% | 2% | 10% |
| Speech impairment | 0% | 2% | 6% |
| Other | 50% | 53% | 43% |
| Don't know | 0% | 2% | 3% |
| Refusal | 4% | 7% | 13% |
| Employment status | |||
| Total: | 500 | 501 | 502 |
| Working full-time (35 hours/week or more) | 48% | 48% | 33% |
| Working part-time (less than 35 hours/week) | 8% | 10% | 12% |
| Unemployed or looking for a job | 3% | 2% | 3% |
| Self-employed | 8% | 11% | 9% |
| Stay at home full-time | 3% | 4% | 2% |
| Student | 6% | 6% | 7% |
| Retired | 21% | 15% | 30% |
| Disability pension | 1% | 2% | 2% |
| Don't know/Refusal | 1% | 2% | 2% |
| Type of home | |||
| Total: | 500 | 501 | 502 |
| House | 87% | 58% | 53% |
| Townhouse | 6% | 9% | 4% |
| Apartment | 3% | 13% | 22% |
| Condominium | 1% | 15% | 18% |
| Long term care centre | 0% | 1% | 1% |
| Student residence | 0% | 1% | 0% |
| Other | 2% | 2% | 1% |
| Don't know/Refusal | 1% | 1% | 1% |
| Annual household income | |||
| Total: | 500 | 501 | 502 |
| Under $20,000 | 2% | 4% | 7% |
| $20,000 to just under $40,000 | 9% | 14% | 16% |
| $40,000 to just under $60,000 | 11% | 11% | 18% |
| $60,000 to just under $80,000 | 12% | 9% | 9% |
| $80,000 to just under $100,000 | 10% | 5% | 8% |
| $100,000 and over | 34% | 35% | 22% |
| Don't know/Refusal | 23% | 22% | 20% |
Return to source of Footnote 4 Elections Canada did not produce any television ads for the by-elections.
Return to source of Footnote 5 Based on Elections Canada preliminary turnout result for the November 26th by-elections.
Return to source of Footnote 6 Elections Canada, Voter Turnout at Federal Elections and Referendums (online), www.elections.ca/content.aspx?section=ele&dir=turn&document=index&lang=e
Return to source of Footnote 7 Totals in this section do not equal 100 for each riding due to rounding, and respondents reporting multiple issues in multiple categories. The grouping of sub-categories for this question was revised on August 21st, 2013.
Return to source of Footnote 8 For the by-elections being held on November 26, 2012, the voter information card was accepted as one of two authorized pieces of identification at polling stations located in long-term care facilities, in seniors' residences, on Indian reserves and in students' residences located on campus.
Return to source of Footnote 9 This question permitted multiple responses; however, each respondent provided only one response.
Return to source of Footnote 10 It should be noted that only 1 of the 24 individuals reported a disability and this respondent cited issues with parking, not physical accessibility.

