 Site Menu
Survey of Candidates of the 41st Federal General Election
Experience with Electoral Process
This section describes candidates' experiences with various aspects of the electoral process. This includes the nomination requirements, the registration, voting and counting processes, voter identification, as well as the appointment of election staff.
Nomination Requirements
The first part describes the results for the questions dealing with candidates nomination requirements.
Most Felt it was Easy to Comply with Nomination Requirements
Most candidates found it moderately (51%) or very (30%) easy to comply with the nomination requirements. Conversely, 17% did not feel this way. There has been virtually no change in perceptions of the nomination requirements since 2008, when 79% of candidates said it was easy to comply with the requirements.
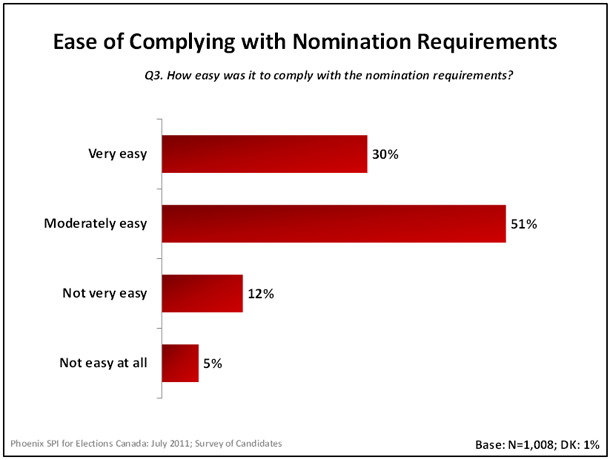
Text version of graph "Ease of Complying with Nomination Requirements".
Sociodemographic Differences
Compared to candidates from Ontario (77%), those from Quebec (86%) were more likely to have found it easy to comply with the nomination requirements. The same was true of candidates who were elected (90% vs. 80% of those not elected) and members of parties in the House of CommonsFootnote 3 (85% vs. 64-65% of members of parties not represented in the HOC and non-affiliated members of Parliament). As well, the likelihood of finding the nomination requirements easy to comply with was higher among candidates who were satisfied with the overall administration of the election (84% vs. 70%) and with the quality of service provided by Elections Canada (83% vs. 63%).
End of boxObtaining Enough Signatures Main Difficulty Experienced in Nomination Process
Candidates who had trouble complying with the nomination requirements (n=176) pointed to a number of reasons to explain why this was the case. The most prevalent reason amongst these, which account for 60%, was related to difficulties in collecting the required number of signatures in their riding. This was the same issue identified most often by candidates of the 2008 general election 54% pointed to this as the main difficulty they experienced with the nomination process. Beyond this, the issues identified by candidates tended to fall into two categories: administrative problems or nomination requirements.
Administrative problems included too much paperwork or bureaucracy (26%), process difficulties for independent candidates and small or new parties (15%), procedures and requirements that were not adequately explained (9%), and returning officers being difficult to deal with (3%). Among administrative problems, two were more likely to be identified in 2011 than in 2008: too much paperwork or bureaucracy (26% vs. 11% in 2008), and difficulties for independent candidates and small or new parties (15% vs. 7% in 2008).
In terms of nomination requirements (in addition to obtaining enough signatures), candidates reported issues with the required $1,000 deposit (15%), trouble meeting the deadline (10%), too much travelling (6%), and difficulty appointing an official agent (5%). The likelihood of identifying issues related to nomination requirements has changed very little compared to 2008.
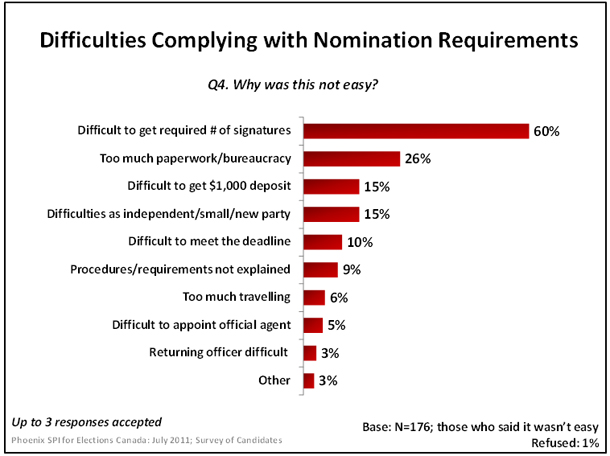
Text version of graph "Difficulties Complying with Nomination Requirements".
Sociodemographic Differences
Candidates in British Columbia (76%) and Ontario (71%) were more likely to point to difficulties getting the required number of signatures. The likelihood of mentioning this as an issue increased with the number of candidacies, from 53% of first-time candidates to 73% of the most experienced candidates.
End of boxVirtually Everyone Felt Nominations Processed in Timely Fashion
Candidates were almost unanimous (97%) in reporting that the returning officer processed their nomination in a timely fashion. Compared to 2008, there has been no change in assessments of timeliness (97% vs. 96% in 2008).
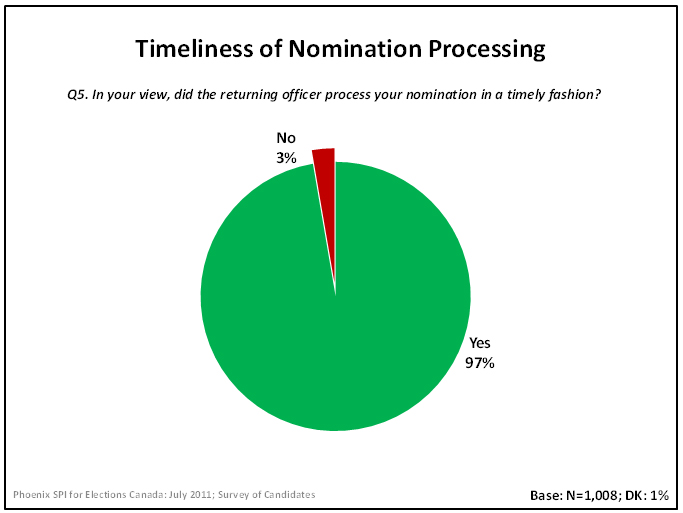
Text version of graph "Timeliness of Nomination Processing".
Sociodemographic Differences
The likelihood of reporting that the returning officer processed their nomination in a timely fashion increased slightly as age and the number of candidacies decreased. As well, it was higher among candidates who were satisfied with the administration of the election (98% vs. 91%), the performance of the returning officer in their riding (99% vs. 81%), and the overall quality of service provided by Elections Canada (98% vs. 87%).
End of boxAppointing Official Agent at Least Moderately Easy for Most Candidates
In total, 82% felt that it was moderately (34%) or very (48%) easy for them to appoint an official agent. This represents a slight increase since 2008 when 77% of candidates said it was at least moderately easy to appoint an agent. Conversely, 18% reported experiencing some difficulty in this regard.
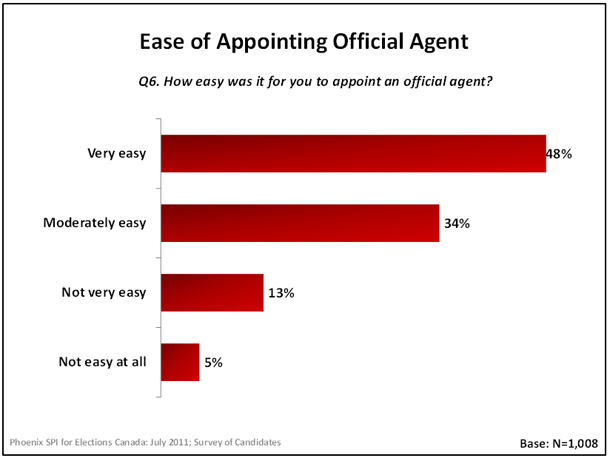
Text version of graph "Ease of Appointing Official Agent".
Sociodemographic Differences
The likelihood of saying it was easy to appoint an official agent was higher among candidates under 30 years of age (88%), those elected (88%), and candidates who felt the nomination requirements were easy to comply with (85%). Conversely, the following candidates were less likely to find this task easy: those dissatisfied with the performance of the returning officer (77%), the administration of the election (72%), and the overall quality of service provided by Elections Canada (72%).
End of boxAppointment of Official Agents Main Difficulties
Among those who encountered difficulties when appointing an official agent (n=176), candidates were most likely to mention that they found it hard to find someone willing or available to do the job (59%). Smaller proportions explained that the job was simply too difficult or involved too much responsibility (41%) or that it was difficult to find someone qualified (36%). As the graph on the next page depicts, relatively few pointed to other problems with regards to appointing an official agent.
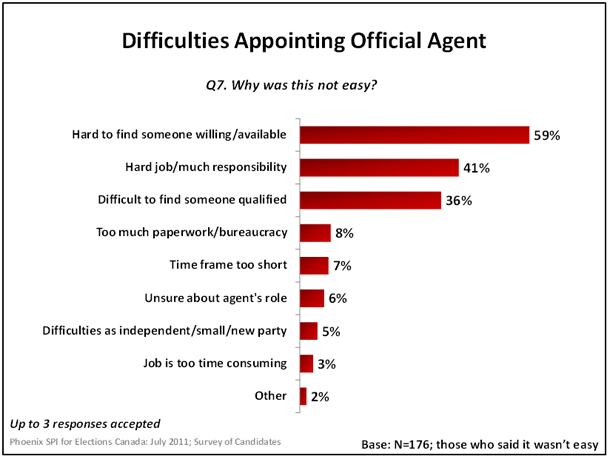
Text version of graph "Difficulties Appointing Official Agent".
Overall, these results are generally consistent with those from 2008, where surveyed candidates were most likely to mention that they found it hard to find someone willing or available, that the job is hard/requires too much responsibility, and that it was difficult to find someone qualified to do the job. As was the case in 2008, these were the top three issues identified by candidates. That said, more candidates had trouble finding someone willing/available this year than in 2008 (59% vs. 40%) and felt that the job is too hard/involves too much responsibility (41% vs. 12%).
Elector Registration, Voting and Counting Processes
Slight Majority Satisfied with Elector Registration
A slight majority (59%) of surveyed candidates said they were satisfied with the way elector registration went. Most of the rest (22%) were neither satisfied nor dissatisfied, while 14% were dissatisfied. This represents a small increase in satisfaction from the 2008 baseline survey when 54% of candidates reported being satisfied with elector registration.
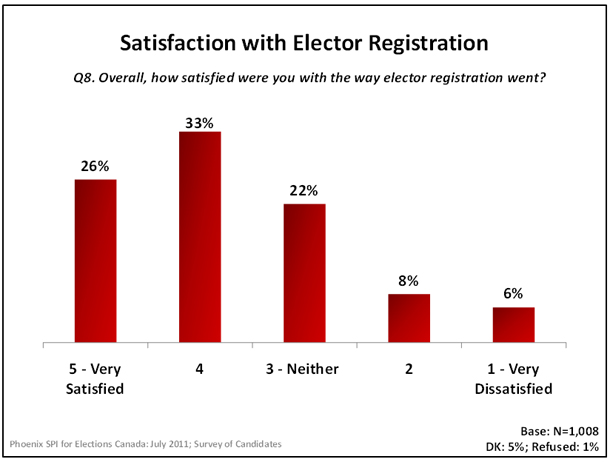
Text version of graph "Satisfaction with Elector Registration".
Sociodemographic Differences
Compared to 59% among all candidates, the likelihood of being satisfied with elector registration was higher among independent candidates (72%), candidates from Quebec (65%), men (63%), and those who ran for the first time (63%). In addition, candidates who were satisfied with the administration of the election (70%), the performance of the returning officer (66%), and the quality of service received from Elections Canada (66%) were more inclined to say they were satisfied with elector registration.
End of boxNumerous Sources of Dissatisfaction with Elector Registration
Candidates who were not satisfied with the way elector registration went (n=133) offered numerous reasons to explain why. The most frequently-cited responses, each mentioned by 26% of candidates, include the perception that the process is too complicated, that the identification requirements turned away genuine votersFootnote 4, and that there were too many errors on the list or too many electors who needed to be registered. Following this, 18% felt that the rules were not enforced consistently, 13% that the timeframe was inadequate for electors, and 10% that electors were unaware of the registration process.
All other reasons, mentioned much less frequently, include insufficient number of registration officers at the polls (7%), revision ineffective or a word in favour of the old enumeration system (7%), voters being confused about voter ID requirements (6%), too few opportunities for registering (3%) and not enough revising agents (2%).
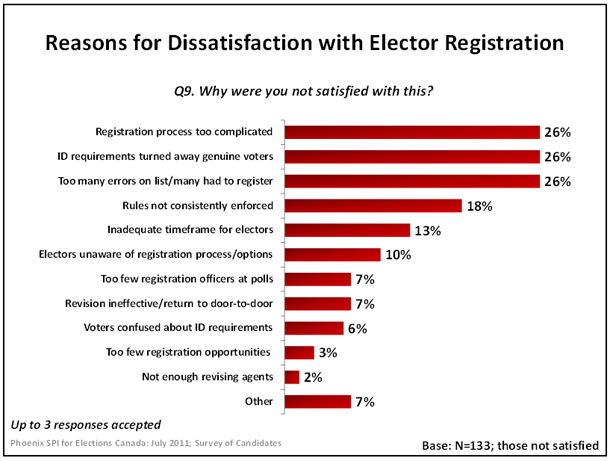
Text version of graph "Reasons for Dissatisfaction with Elector Registration".
Most Candidates Satisfied with All Aspects of the Voting Process
Most candidates were satisfied with each aspect of the voting process. Specifically, 69% were satisfied with the way the vote counting proceeded in their riding, 67% with the locations chosen as polling stations, and 65% with the way the various options for electors to cast a ballot went. Those candidates who were not satisfied with each of these aspects tended to be neutral as opposed to dissatisfied.
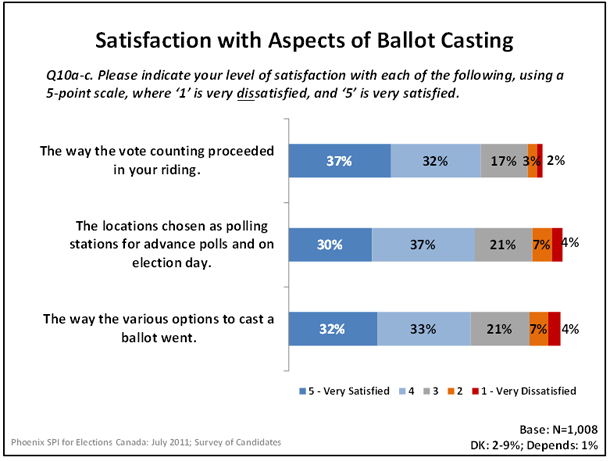
Text version of graph "Satisfaction with Aspects of Ballot Casting".
Perceptions are virtually identical to those offered by candidates in 2008.
Sociodemographic Differences
To the extent that subgroup differences were evident when it came to perceptions of the voting process, men and candidates from Quebec were more inclined to express satisfaction with the way the various options to cast a ballot went and the way the vote counting proceeded in their riding. Candidates who were satisfied with the administration of the election, the performance of the returning officer in their riding, the overall quality of service received from Elections Canada, and the elector registration process were more likely to offer positive assessments of the voting process.
End of boxLack of Training Top Reason for Dissatisfaction with Vote Counting in Riding
Candidates dissatisfied with the way the vote counting proceeded in their riding (n=53)Footnote 5 were most likely to attribute this to their perception that the workers were not properly trained (43%). In addition, similar proportions felt the counting was too slow (32%) or that there was tampering or interference in the process (30%). Following this, 15% said there was a lack of security or supervision. A small number were dissatisfied because they felt the election materials were tampered with (6%) and questions were not adequately answered (4%).
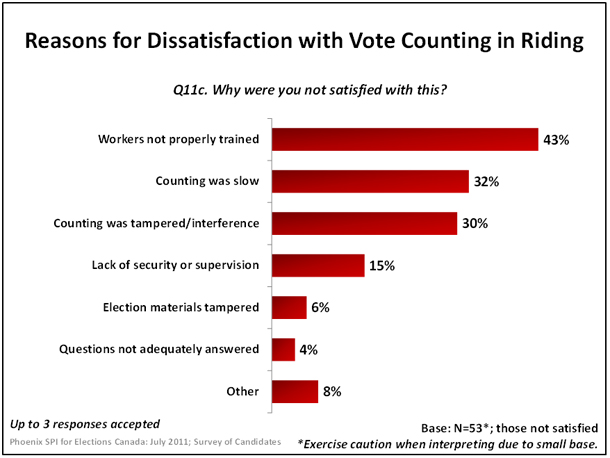
Text version of graph "Reasons for Dissatisfaction with Vote Counting in Riding".
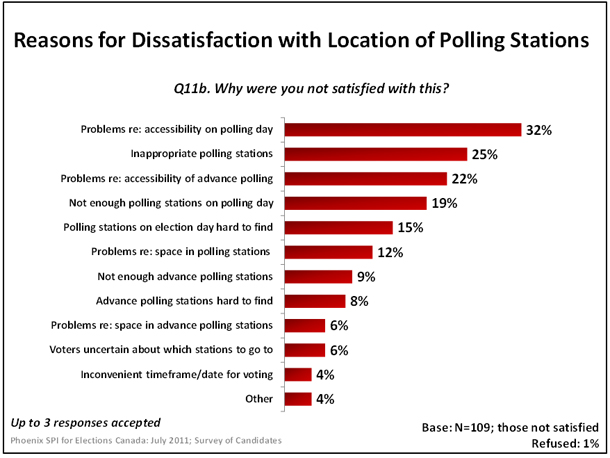
Accessibility Main Reason for Dissatisfaction with Location of Polling Stations
Candidates who were not satisfied with the locations chosen as polling stations for the advance polls and on election day (n=109) most often pointed to accessibility generally to explain their dissatisfaction. Approximately one-third (32%) cited problems with the accessibility of polling stations on election day and 22% with the accessibility of the advance polling stations.
Text version of graph "Reasons for Dissatisfaction with Location of Polling Stations".
Other more specific reasons related to the locations chosen for the polling stations. Some were seen to be inappropriate (i.e. churches) (25%), while others were felt to be hard to find either on election day (15%) or for the advance polls (8%). As well, in terms of quantity, some candidates thought there were too few polling stations on election day (19%) or for advance voting (9%). Others cited issues with the stations' set-up, including problems of space on election day (12%) and at the advance polls (6%). Finally, some also explained their dissatisfaction with the polling station locations by noting that voters were uncertain about which station to go to (6%) and that the timeframe for voting was inconvenient (4%).
Problems regarding accessibility on polling day were less likely to be identified in this election (32% vs. 41% in 2008). On the other hand, there was a greater likelihood of identifying inappropriate polling locations (25% vs. 7% in 2008), and not enough polling stations on polling day (19% vs. 7%).Footnote 6
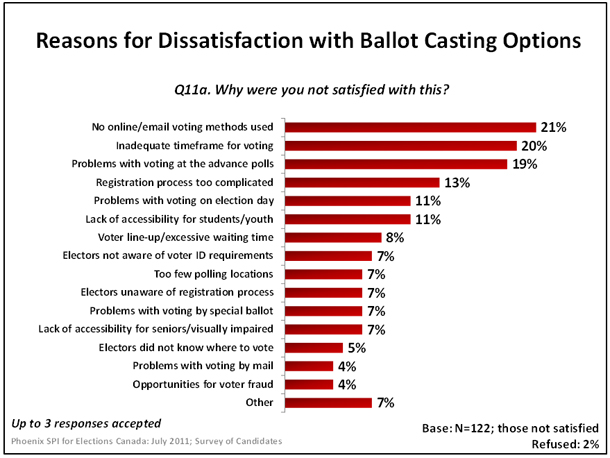
Varied Reasons Offered for Dissatisfaction with Ballot Casting Options
Candidates who were not satisfied with the ballot casting options (n=122) offered varied reasons to explain why. The top three reasons, each mentioned by approximately one-fifth of candidates who expressed dissatisfaction, were lack of online or email voting (21%), inadequate timeframe for voting (20%), and voting problems at the advance polls (19%). When the feedback is grouped together, three broad themes emerge: issues with identification and registration, issues with the specific methods of voting, and problems with voting procedures.
Looking first at identification and registration, 13% felt the registration process was too complicated, 7% that electors were unaware of the identification requirements, and 7% that electors were unaware of the registration process.
Issues with specific voting methods included problems with voting at the advance polls (19%), voting on election day (11%), voting by special ballot (7%), and voting by mail (4%). In addition, one in five were critical that no online or email voting was used.
Finally, focusing on procedural issues, candidates were dissatisfied with the timeframe for voting (20%), the lack of accessibility for students and youth (11%) as well as for seniors and those visually impaired (7%), voter line-ups and excessive wait times (8%), the number of polling locations (i.e. the perception that there were too few stations) (7%), that electors did not know where to vote (5%), and the opportunities for voter fraud (4%).
Text version of graph "Reasons for Dissatisfaction with Ballot Casting Options".
Voter Identification
Most Did Not Witness Problems with Voter ID Requirements
Most candidates (72%) said that neither they nor their representatives witnessed any problems related to the implementation of the voter identification requirements. That said, one-quarter (26%) did witness problems.
Fewer candidates stated that they had witnessed any problems with the implementation of voter identification requirements in 2011 (26%) than in 2008 (37%).
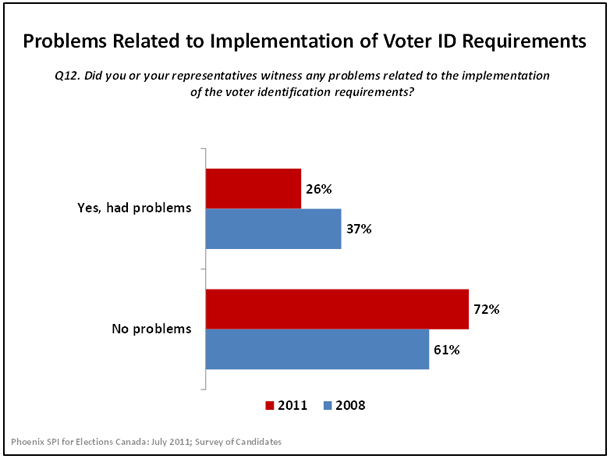
Text version of graph "Problems Related to Implementation of Voter Identification Requirements".
Sociodemographic Differences
Compared with 26% overall, the likelihood of witnessing problems with voter identification was higher among candidates from Atlantic Canada (45%), those elected (40%), the most experienced candidates (35%), and those 30 years of age and older (28%). As well, candidates who were dissatisfied with elector registration (54%), the administration of the election (42%) and the performance of the returning officer in their riding (43%) were more likely to have witnessed problems.
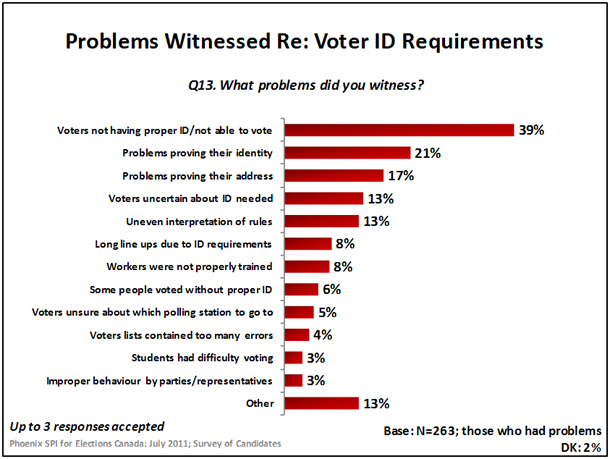
End of boxImproper ID/Unable to Vote Top Problem with Voter ID Requirements
Candidates who indicated that they or their representatives witnessed problems with the voter identification requirements (n=263) identified a number of issues. That said, the top problem, cited by 39%, was voters not having proper identification or being unable to vote.
Other issues included voters having problems proving their identity (21%) address (17%), and being uncertain about the identification needed (13%). Thirteen percent of candidates pointed to what they perceived as the uneven interpretation of the rules by election officers.
All other reasons were identified by 8% or less. They include long line ups due to ID requirements (8%), poll staff insufficiently trained (8%), some electors voting without the proper IDs (6%), voters unsure about which polling station to go to (5%), voters list containing too many errors (4%), student facing difficulties voting (3%) and improper behaviours by party representatives (3%).
Problems included in the 'other' category are no verification of citizenship, lack of service in voter's language, voter line-up and excessive waiting time, voter fraud and people voting multiple times, as well as voters being asked to remove facial coverings, among other issues.
Text version of graph "Problems Witnessed with Regard to Voter Identification Requirements".
Majority Hold Positive View of List of Acceptable ID Documents
Asked what, if anything, candidates thought about the list of acceptable pieces of identification established by the Chief Electoral Officer, the majority (71%) were satisfied and reported no problems. This represents a considerable increase since 2008 when only 54% expressed satisfaction with the list of acceptable identification documents.
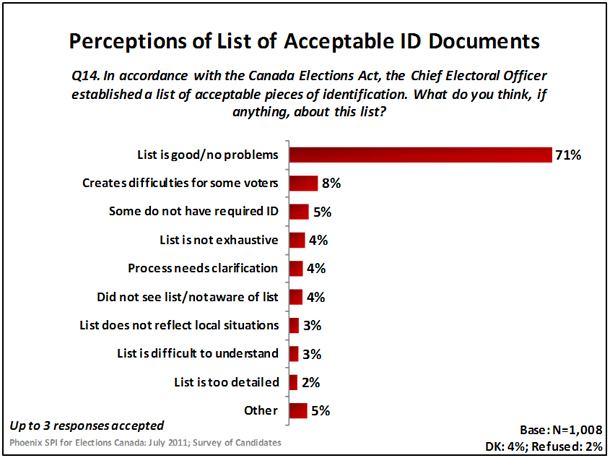
Text version of graph "Perceptions of List of Acceptable Identification Documents".
Those who were less content pointed to numerous issues as can be seen in the accompanying graph. The reasons for dissatisfaction include difficulties for some voters (8%), some voters lacking ID documents (5%), list not exhaustive enough (4%), process lacking clarity (4%), list not reflecting local situations (3%), difficult to understand (3%) or too detailed (2%).
Sociodemographic Differences
Compared to an overall satisfaction rate of 71%, the likelihood of being satisfied with the list of acceptable documents was higher among candidates from Quebec (86%), those under 30 years (84%), first-time candidates (75%), and men (73%). Candidates were more likely to hold positive perceptions of the list if they were satisfied with elector registration (81%), the overall administration of the election (75%), the performance of the returning officer (74%), and the overall quality of service received from Elections Canada (74%).
End of boxAppointment of Election Staff
According to the Canada Elections Act, candidates who have been elected or have come second in a general election are entitled, for the next general election, to submit to the returning officer a list of names of those who are to be appointed as revising agents, deputy returning officers and poll clerks. The question dealt with in the text that follows was only asked of candidates who placed first or second in the previous federal general election (n=158).
Majority Did Not Have Problems Providing List of Election Staff Appointees
In 2011, no fewer than 63% of candidates who were entitled to submit a list of names of individuals to be appointed as electoral staff did not experience any challenges or problems in this regard, up from 49% in 2008.
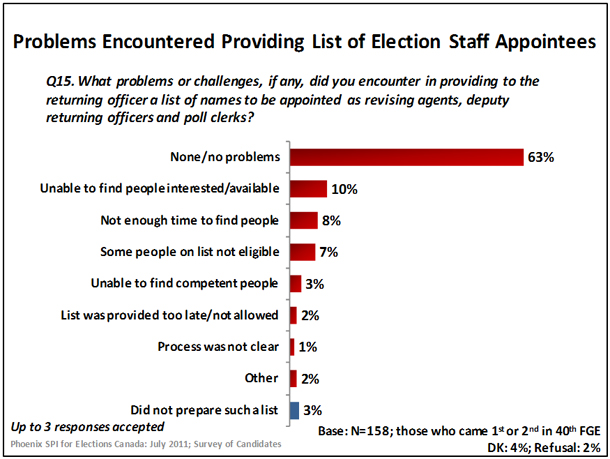
Text version of graph "Problems Encountered Providing List of Election Staff Appointees".
Of those who did encounter problems, candidates were most likely to have been unable to find people interested or available (10%), followed by not having enough time to find suitable people (8%) and finding that people on their list were not eligible (7%). Very few pointed to other problems with staff appointees, including being unable to find competent people (3%), providing list past the deadline (2%) and process unclear (1%).
Compared to 2008, two problems were less likely to be identified: inability to find people interested or available (10% vs. 18% in 2008), and inability to find competent people (3% vs. 10% in 2008).Footnote 7
Return to source of Footnote 3 From this point forward, 'HOC' will be used to denote House of Commons.
Return to source of Footnote 4 Note that ID requirements are not the same for registering and for voting. Though candidates did not specify which set of rules they had in mind, it should be noted that ID requirements at the time of voting have been more contentious since their introduction in 2007.
Return to source of Footnote 5 Caution is to be used in interpreting these results due to the small sample size.
Return to source of Footnote 6 Caution should be exercised when interpreting these differences given the relatively limited number of candidates expressing dissatisfaction in this area (i.e. n=109 in 2011 and n=118 in 2008).
Return to source of Footnote 7 Caution should be exercised when interpreting these differences given the relatively small number of candidates who encountered problems in this area in 2008 (n=84).