 Site Menu
Report on the Evaluations of the 41st General Election of May 2, 2011
1. Voters' Experience of the Election
1.1 Voter Awareness and Outreach
Key Findings
- Ninety-eight percent of eligible voters reported being aware of the 41st general election.
- As in 2008, Canadians relied primarily on the voter information card for information about when and where to vote.
- Elections Canada's multi-channel advertising campaign continued to support high levels of awareness.
- The agency's new outreach efforts targeted at seniors living in residences and long-term care facilities contributed to reducing the barriers to voting faced by these electors.
Elections Canada places a high priority on ensuring that Canadians understand the electoral process, including how they can exercise their right to vote. The agency also undertakes specific efforts to reach target groupsFootnote 2 who are likely to experience barriers to participation, such as the inability to prove their address or limited knowledge of the various ways to vote.
For the 41st general election, Elections Canada carried out a comprehensive, multi-channel electoral reminder program. It consisted of direct mail to electors (e.g. the voter information card, or VIC), the Community Relations Officer Program and an information and advertising campaign for the general population as well as specific target groups to make them aware of the requirements and options for voting.Footnote 3
Elections Canada sent VICs to some 24 million registered electors. The VIC remains the primary source of information about when and where to vote. In selected locations, when they presented it along with one other authorized piece of identification, seniors, students and Aboriginal electors could also use the VIC to prove identity and address. This initiative is discussed further in section 1.2.
As in the previous election, community relations officers worked with specific target groups of electors namely, youth, Aboriginal and ethnocultural communities, and homeless electors to raise awareness about the electoral process. Guided by the evaluations of the 40th general election, Elections Canada expanded the Community Relations Officer Program to include community relations officers for seniors living in residences and long-term care facilities; this enabled us to address the specific registration and identification barriers faced by these electors.
Key changes to the communications campaign for the 41st general election included a redesigned website; new advertising vehicles, such as regular and digital advertising billboards in public places; and a greater use of ads on popular social media websites.
Overall findings
The Survey of Electors found that 98 percent of respondents reported being aware of the 41st general election. They cited traditional media television (81 percent), newspapers (50 percent) and radio (42 percent) as their main sources of information about the election. The recall rates for Elections Canada's advertising (how well respondents recalled the information provided) have remained consistent over the last three elections at 79 percent in 2006, 78 percent in 2008 and 79 percent in 2011.Footnote 4
Levels of awareness were lower among Aboriginal electors (89 percent compared with 98 percent in the general population). Television remained their main source of information about the election.
A key element of the electoral reminder program was the VIC, and some 91 percent of electors who were aware of the election recalled receiving one. As with the previous election, Canadians tended to rely on the VIC for information about voting procedures, including when and where to vote. Electors identified the VIC as the source of information on voting procedures most often and by a considerable margin (66 percent), followed by television (12 percent) and newspapers (11 percent). We will continue to regularly evaluate the effectiveness of the electoral reminder program and refine it to reflect the changing media landscape.
Expanding the Community Relations Officer Program to include seniors living in residences and long-term care facilities, together with the agency's targeted revision initiative, contributed to increased elector registrations, which rose by an estimated 36 percent over the 2008 election.
| 2011 | 2008 | Change |
|---|---|---|
| 100,616 | 73,761 | 26,855 (36.4%) |
After the election, Elections Canada surveyed administrators in student residences, First Nations band offices and seniors' residences and long-term care facilities. Of those who had used a community relations officer, all were satisfied with their services, which included working with the administrators to facilitate the registration and voting process.Footnote 5
The surveys and other data indicate that the channels used by electors to obtain information and to communicate with Elections Canada are evolving. For example, more electors are using our website to obtain information: we received more than 5 million visits in 2011 compared with 3 million in 2008. While we received fewer calls from electors during the 2011 election, the number of e-mails received increased. For the first time, electors wishing to lodge a complaint had the option of sending it as an e-mail through the Elections Canada website. As a result, between March 26 and May 8, 2011, we received more than 6,000 e-mails communicating complaints, comments and general inquiries. (For more details on the nature of these complaints, see section 3.5.)
Conclusion
Overall, the agency's electoral reminder program was successful in informing Canadians about the electoral process. This is consistent with our findings from the 2008 election. We will continue to evaluate the effectiveness of the program and make refinements to it.
Canadians are increasingly using online services and e-mail to communicate with Elections Canada. As a result, we are taking steps to enhance the accessibility of our website and improve our e-mail response capacity to take advantage of these rapidly growing communication channels of choice for many stakeholders.
Elections Canada will continue to refine its outreach efforts to address awareness barriers for specific groups of electors. Experience from the field shows that establishing relationships with target groups before an election can enhance and facilitate the work of community relations officers. Elections Canada will explore undertaking local outreach and targeted registration drives before the call of the next general election.
1.2 Voter Identification Requirements
Key Findings
- Ninety-seven percent of electors were aware of the requirement to present proof of identity, and 89 percent knew about proof of address, before voting.
- Ninety-nine percent of those who voted said that it was easy to meet the identification requirements.
- The administrative change to allow the VIC to be used in combination with another authorized piece of identification to facilitate proof of identity and address for students living on campus, electors living on Aboriginal reserves and seniors in residences helped reduce the proof-of-identification barrier, particularly for seniors.
The 41st general election was the second in which electors were required to prove their identity and address before they could vote. A key component of Elections Canada's electoral reminder program was to ensure that electors were aware of the identification requirements and that they came to the polls prepared to satisfy them.
The evaluations of the 2008 election noted that some electors had found it more difficult to satisfy the voter identification requirements, particularly those for proof of address. Therefore, for this election, Elections Canada implemented an administrative change to allow the use of the VIC, in combination with another authorized piece of identification, to facilitate proof of identity and address for certain categories of electors in specific locations: students living on campus, Aboriginal electors living on reserves and seniors living in residences and long-term care facilities.
Overall findings
Overall, 97 percent of electors were aware before the election that they had to present proof of identity in order to vote (compared to 94 percent in 2008), while a slightly lower percentage (89 percent) were aware that they also had to present proof of address (up from 85 percent in 2008). The main source of information on voter identification requirements was the VIC, cited by 41 percent of those aware of the identification requirements, compared with only 27 percent in 2008.
Ninety-seven percent of voters said it was easy to meet the identification requirements. Ninety-nine percent of those who voted at the polls on election day said they had brought the required identification with them. Ninety percent of voters said they had used their driver's licence for identification, followed by their health card (16 percent) and VIC (14 percent).Footnote 6
At 94 percent, Aboriginal voters were slightly less likely than the overall voter population (99 percent) to have the required identification with them.
There is a growing perception among the general population that the VIC can be used as a piece of identification at all polls. Compared to the previous election, the proportion of voters who reported using their VIC as a piece of identification increased by 11 percentage points. Of these voters, 91 percent reported having used their VIC along with another piece of identification, which was sufficient in itself to meet the requirements.
Aboriginal electors were less likely to have a positive view of the identification requirements than the general population (90 percent compared to 96 percent).
As in the 2008 election, 96 percent of electors had a positive attitude toward the identification requirements.
Among the surveyed candidates, 72 percent reported that they or their representatives had witnessed no problems related to the voter identification requirements, an increase of 11 percentage points over 2008. The most common problem, cited by 39 percent of candidates who reported problems, was that electors did not have proper identification or were unable to vote. As for the list of authorized pieces of identification, 71 percent were satisfied or reported no problems with it (up from 54 percent in 2008).
Evaluation research indicates that the new procedure to allow electors in certain locations to use their VIC along with another authorized piece of identification to prove their identity and address was a success. For example, some returning officers (ROs) stated that voting at the polls went much faster, and many administrators in long-term care facilities reported that it was easier for residents to vote. In addition, evidence from a small sample of targeted locations indicates that a majority of seniors in these locations used their VIC as identification.
We were limited in applying this initiative to student residences because the timing of the election coincided with the end of the school term. In addition, our post-election evaluation tools did not provide sufficient data to assess the impact of this initiative on Aboriginal electors on reserves. The agency aims to refine its evaluation tools to provide better coverage in subsequent general elections.
Conclusion
Overall, the voter identification process went well, as it did in 2008. Almost all electors were aware of the identification requirements, accepted them and came to the polls prepared to satisfy them.
As the VIC, used in combination with another authorized piece of identification, can facilitate proof of identity and address for many electors, Elections Canada intends to examine options for expanding this feature to include all electors. This will simplify the administration of the voter identification regime and make it more consistent and coherent.
1.3 Convenience and Accessibility
Key Findings
- Consistent with the 39th and 40th general elections, 97 percent of voters in the 41st general election reported that the distance to their voting location was convenient.
- Ninety-eight percent of voters found polling site buildings to be physically accessible.
- Turnout at the advance polls was the highest in history. Despite the fact that Elections Canada hired additional election officers, there were still delays at the polls. They were partly a result of constraints imposed by the Canada Elections Act.
- The number of electors who voted by special ballot increased by 11 percent over the 2008 election. The most common challenges they faced were the tight deadlines for receiving and mailing special ballots and difficulty submitting proof of identity and address.
For the 41st general election, a new Polling Site Accessibility Feedback Form was made available at all polling sites and local Elections Canada offices; it was also posted on the Elections Canada website.Footnote 7 It enabled electors to provide feedback about accessibility immediately at the polling site or later by telephone, fax, postal mail or e-mail. ROs collected the forms and were responsible for following up with electors if they requested it; they also resolved complaints whenever possible.
In anticipation of an increase in the number of Canadians wishing to vote in advance on the Easter long weekend and Passover, the agency hired an additional 3,602 election officers (a 28 percent increase) to reduce possible delays at the polls.
As in previous general elections, electors had the option of voting by special ballot by mail or in person at any local Elections Canada office. Elections Canada undertook a number of outreach initiatives to increase awareness of the voting options available to Canadians temporarily living outside Canada, Canadian Forces electors and incarcerated electors.
Polling site accessibility
For the 41st general election, the Chief Electoral Officer approved 20 polling sites that had no level access out of a total of 15,260 sites, compared to 40 sites in 2008. Ninety-eight percent of electors and 96 percent of electors with a disability found the buildings to be accessible. Ninety-five percent of voters were satisfied with the directional signage posted inside the polling sites, while 82 percent were satisfied with the signs posted outside. Voters with a disability reported similar results. A total of 1,223 accessibility feedback forms reported accessibility issues; many related to problems with parking and signage. ROs have responded to all of the complaints.
For the next general election, Elections Canada will continue to ensure that polling sites are accessible to the greatest extent possible. As in this election, the agency will approve locations with no level access only in exceptional circumstances i.e. where no other options are available. ROs have suggested reviewing polling sites earlier so that they can visit them all and ensure that they meet accessibility standards. Elections Canada will consider changing the timing of such pre-election tasks to accommodate this.
Getting to the polls
A full 97 percent of voters found that the distance to their voting location was convenient, and 98 percent had no difficulty reaching it. These results are similar to those for the 2006 and 2008 elections. As for the advance polls, distance can remain a barrier to voting, particularly in remote regions, Elections Canada will continue to increase the number of advance polls and facilitate the delivery of advance poll services in those areas.
A greater proportion of Aboriginal voters found the distance to their polling station convenient in 2011 (95 percent) compared to 2008 (89 percent).
Advance polls
The proportion of electors who voted at the advance polls increased in 2011 over 2008 (17 and 11 percent, respectively). This was the highest advance poll turnout in history.
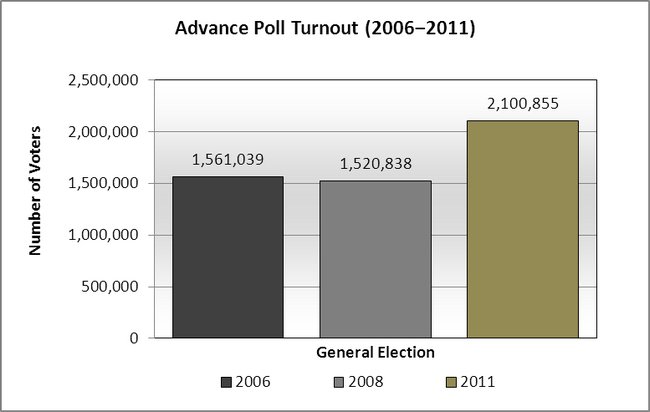
Text version of graph "Advance Poll Turnout (2006–2011)"
Electors regard the advance polls as additional days to vote, and they expect the same service and ease of voting as on election day. In 2011, the dates of the advance polls coincided with statutory and religious holidays, and this may have contributed to increased attendance at the advance polls.
The Canada Elections Act provides for one advance polling station for each advance polling district. It also provides for the days and number of hours that the service will be offered. Unlike election day polling divisions, which can be divided during an election into as many polling stations (ballot boxes) as necessary to accommodate a sudden increase in the size of the voters list of a polling division during revision, an advance polling district cannot be divided unless circumstances are such that they warrant the Chief Electoral Officer to adapt the law. For recent elections, ROs have coped with the historical increase in voting at the advance polls by carving out new and ever smaller advance polling districts before the election is called, based on turnout at the previous election. Given the fixed date of the next election October 19, 2015 advance polls will be conducted over the Thanksgiving weekend. Therefore, before that election, ROs will review advance polling districts and carry out the necessary revision to accommodate a potentially high turnout at the advance polls.
To better serve electors in the 41st general election, Elections Canada added 653 advance polls (an increase of 17 percent over the 2008 election). Elections Canada also significantly increased the number of advance poll workers in an attempt to alleviate congestion. Despite the ROs' best efforts, however, there were delays at the advance polls. Complaints about long lineups and wait times at the advance polls represented the second-largest category of complaints sent by e-mail to the Chief Electoral Officer (9 percent of some 3,700 complaints).
These delays are challenging to address. Not only is it difficult to forecast the number of people who will use the advance polls, but the law prescribes additional steps for voting at the advance polls, which adds time and complexity to the process.
This issue highlights the need to look at ways to better manage the advance voting process. As proposed in the Chief Electoral Officer's 2010 recommendations report, potential solutions could include more flexibility in appointing election officers and the creation of a new category of election officers assigned to various tasks. However, a larger re-engineering of poll operations for both advance and ordinary polls is required. This issue is discussed further in section 3.3.
Voting by special ballot
The use of special ballots by Canadians continues to increase. In all, 285,034 special ballots were cast in this election (including 5,680 rejected ballots), compared with 257,972 in the previous one an increase of 11 percent. More electors reported being aware of the option to vote by special ballot in 2011 compared with 2008 (43 percent vs. 35 percent).
The report of the Chief Electoral Officer following the 41st general election provides an in-depth assessment of the special ballot process and outlines a number of issues. As in previous elections, some electors faced challenges with the tight deadlines for receiving and mailing their ballot as well as difficulty submitting proof of identity and address.
To address these challenges, Elections Canada believes that a possible solution lies with Internet voting (I-voting), which would allow electors to vote when and where they want. The agency will continue to monitor I-voting trials and developments in other jurisdictions to evaluate its feasibility at the federal level. In due time, Elections Canada plans to seek approval of parliamentarians to conduct some form of I-voting pilot project in an electoral event.
In the short term, voting by special ballot remains a convenient and flexible option for electors temporarily away from their home riding. For the next election, Elections Canada will consider options for establishing new locations for voting by special ballot, such as university and college campuses, and community centres serving electors with disabilities.
1.4 Voter Participation
Key Findings
- Voter turnout was 61.1 percent for the 41st general election, an increase of 2.3 percentage points over the 40th general election.
- The general population is increasingly citing everyday life issues as a main reason for not voting, and people are expecting Elections Canada to provide flexible services to accommodate their changing needs and busy schedules.
Turnout
As indicated in the evaluations report for the 2008 election, Canada began experiencing an accelerating trend of declining turnout in the early 1990s. A similar trend has occurred in most provincial jurisdictions and other established democracies around the world.
Including advance polls, special ballots and ordinary polls, the total number of voters in the 41st general election was 14,823,408, or 61.1 percent of registered electors (58.5 percent of eligible electors). This represents an increase in turnout of 2.3 percentage points over the 2008 general election, but a decrease of 3.6 percentage points compared to the 2006 election (64.7 percent). From 2008 to 2011, the turnout rate in federal elections increased in all provinces and territories except Nunavut.
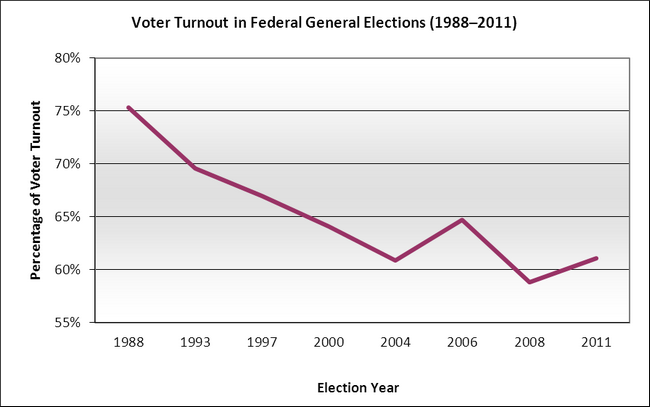
Text version of graph "Voter Turnout in Federal General Elections (1988–2011)"
Reasons for not voting
In 2011, 60 percent of non-voters cited everyday life issues as the reason for not voting. Half as many (30 percent) identified political issues, while 6 percent cited issues related to the electoral process itself.
Over the past several elections, there has been a steady rise in the proportion of electors who have identified everyday life issues as the main reason for not voting and a steady decline for political reasons, as shown in the table below. The proportion of respondents who have identified administrative or electoral process issues has remained relatively stable.
| Reason | 2004 (%) | 2008 (%) | 2011 (%) |
|---|---|---|---|
| Everyday life issues | 38 | 57 | 60 |
| Political issues | 45 | 36 | 30 |
| Administrative or electoral process issues | 7 | 8 | 6 |
*In 2006, a different methodological approach was used, which prevents direct comparisons with other years.
The table below provides a breakdown of the reasons for not voting in the 2011 general election.
| Everyday life issues 60% | Political issues 30% | Administrative or
electoral process issues 6% |
|---|---|---|
|
|
|
Conclusion
There is an increasing trend among Canadians to identify everyday life issues as a significant reason for not voting. This trend may be caused by deeper, underlying issues, but nevertheless, electors are increasingly expecting flexible services to accommodate their changing needs and busy schedules. Online services, such as the online voter registration service that the agency recently implemented, offer a way to respond to these expectations. However, the functionality of the online registration service is limited by the current requirements of the Canada Elections Act. Without the legislated changes described in the Chief Electoral Officer's 2010 recommendations report, new electors can register online only if they have already given their consent through income tax returns and have a driver's licence. It is also not possible to do inter-riding address updates during an election.
While there is no single solution to the problem of declining voter turnout, a majority of non-voters (57 percent) stated that they would have voted had it been possible to do so over the Internet using the Elections Canada website.
1.5 Young Canadians' Experience of the Election
Elections Canada commissions separate, more in-depth studies to better understand young Canadians' experience of elections and the barriers they face. These studies find that voter turnout for youth is considerably lower than for the general population,Footnote 8 as shown in the following figure.Footnote 9
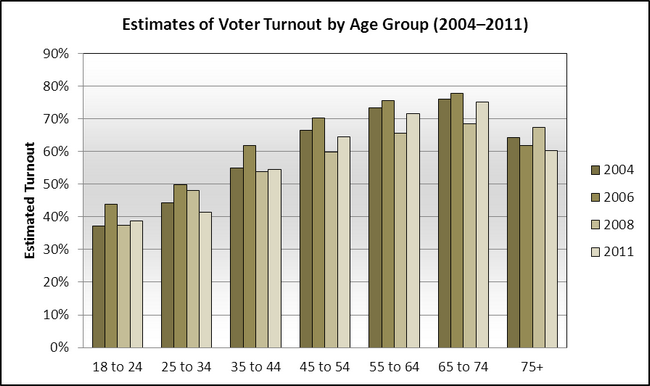
Text version of graph "Estimates of Voter Turnout by Age Group (2004–2011)"
As in the past, the agency conducted a study of turnout by age group in the 2011 general election based on a sample of voters and data in the National Register of Electors; to provide information on their experience at the polls, the Survey of Electors included 500 youth respondents aged 18 to 24. Additionally, Elections Canada commissioned a new National Youth Survey to better understand the reasons why youth may or may not participate in the electoral process. This study is the most comprehensive yet of the democratic participation of young Canadians. Youth from the following subgroups were also represented in the study: Aboriginal youth, youth living in rural areas, unemployed youth not in school, youth with disabilities and ethnocultural youth. (For the number of respondents in each subgroup, see Appendix 1.)
To compare factors related to voting and non-voting across different age groups of young Canadians, the National Youth Survey broadly defined youth as those between the ages of 18 and 34. This allowed the study to explore differences between 18- to 24-year-olds who show the most pronounced long-term decline in turnout and 25- to 34-year-olds, who have had the opportunity to vote in a number of elections. This broader definition also resonates with the changing definition of youth in our society.
The discussion below highlights the key findings from each of these studies.Footnote 10
Key Findings
- General awareness levels continued to be slightly lower among youth than in the general population (94 percent versus 98 percent).
- Nearly half of all Canadians aged 18 to 34 were unaware of any of the options for voting other than at the polls on election day.
- Among non-voting youth, proof-of-identity and address requirements were an important barrier to voting, particularly among Aboriginal youth, youth with disabilities and unemployed youth.
- About one quarter of young non-voters said that difficulty getting to the polls influenced their decision not to vote.
- Youth voter participation has been declining since the 1970s, and it is the main contributor to the overall trend of declining turnout that began in the early 1990s. The National Youth Survey examined the specific barriers to voting among young people and found that motivational factors outweigh accessibility factors as the primary determinants of non-voting.
Youth awareness
The Survey of Electors found that youth aged 18 to 24 were slightly less aware of the election (94 percent) than the general population of eligible voters (98 percent). While youth were less likely than the rest of the population to rely on traditional media, television remained their main source of information about the election. Compared with the general population, youth were more likely to hear about the election through word of mouth.
While general awareness of the election was high, awareness of various options for voting (i.e. advance polls, by mail, at the local Elections Canada office) was not. The National Youth Survey revealed that nearly half of all Canadians aged 18 to 34 were unaware of any of the three options for voting other than at the polls on election day. This lack of awareness was higher among ethnocultural youth (59 percent), disabled youth (64 percent), unemployed youth (67 percent) and Aboriginal youth (73 percent).
Elections Canada will continue to improve its efforts to inform youth about the voting process and the alternatives available to them.
Young voter registration
Registration rates increase significantly by age group: in the last four federal elections, the rate among 18- to 24-year-olds was on average 20 percentage points lower than among those aged 35 and over. For 25- to 34-year-olds, the registration rate has been consistently higher than among the youngest age group, but still on average 6 percentage points lower than those aged 35 and over.
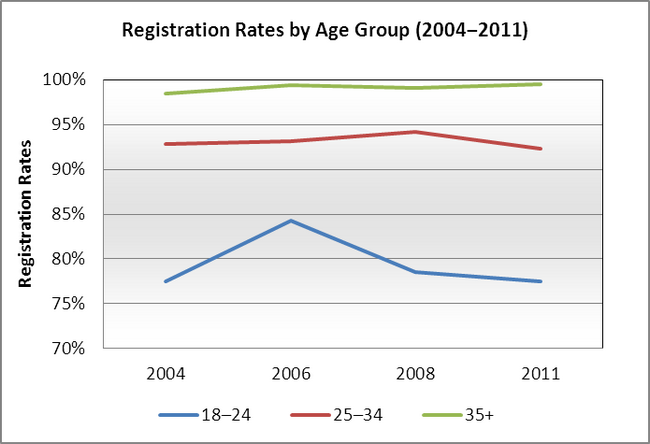
Text version of graph "Registration Rates by Age Group (2004–2011)"
The lower registration rate among young people is directly linked to their lower rate of receiving the VIC.Footnote 11 Since the VIC is a key source of information about voting procedures, this explains at least in part their lower awareness of the various options for voting. Not receiving the VIC is particularly prevalent among Aboriginal youth, unemployed youth and disabled youth. The National Youth Survey also found that voting rates were significantly lower among youth who reported not receiving a VIC (62 percent) than those who reported receiving one (79 percent).
For these reasons, Elections Canada will place particular emphasis on registering youth and other groups that experience lower levels of registration (such as Aboriginal electors living on reserves) before the next general election. In doing so, we will encourage the use of our recently launched online voter registration system and focus our outreach efforts on these electors.
Identification requirements
The National Youth Survey found that among Canadians aged 18 to 34 who did not vote, 15 percent said that their decision was influenced by their inability to provide proof of identification, while 16 percent indicated that they were influenced by their inability to provide proof of address. These barriers were particularly pronounced among Aboriginal youth (20 percent and 23 percent, respectively), youth with disabilities (28 percent and 33 percent) and unemployed youth (21 percent and 22 percent).
Ongoing outreach is required to better inform youth and specific subgroups about voter identification requirements and how to meet them. Elections Canada will explore using local outreach field staff to reach out to these electors before the next general election and engage post-secondary institutions, student associations and youth organizations to ensure that electors have the information they need to register and vote. We will also continue working with Aboriginal organizations, disability groups and ethnocultural groups to reach youth from these specific subgroups. Finally, as indicated in section 1.2, Elections Canada intends to examine options for expanding the use of the VIC, in combination with another authorized piece of identification, to facilitate proof of identity and address. This can further reduce identification barriers for youth, particularly those groups of youth least likely to vote.
Convenience and accessibility
The National Youth Survey found that nearly one quarter (24 percent) of youth non-voters cited difficulty in getting to the polls (transportation issues) as influencing their decision not to vote. Getting to the polling station was particularly difficult for single parents, among whom self-reported turnout was 13 percentage points lower than for the sample as a whole.
Among those who voted, nearly all perceived voting in a federal election to be easy and convenient (98 percent); the majority of non-voters also thought this to be the case (82 percent). Most voters strongly agreed that they felt welcome at the polling station (76 percent), while the majority of non-voters strongly agreed that they would have felt welcome at a polling station had they voted (59 percent).
However, the responses among the youth subgroups differed. Among voters, youth with disabilities (61 percent), ethnocultural youth (65 percent) and unemployed youth (67 percent) were less likely to strongly agree that they felt welcome at the polling station. Among non-voters, Aboriginal youth (41 percent) and unemployed youth (40 percent) were the least likely to strongly agree that they would have felt welcome at a polling station.
Youth voter participation
Youth voter participation has been declining since the 1970s, and it is the main contributor to the overall decline in voter turnout in Canada. The study on turnout by age group found that in 2011, the turnout rate was 39 percent among electors aged 18 to 24 and 42 percent among those aged 25 to 34. In contrast, 72 percent of those aged 55 to 64 voted, as did 75 percent of those aged 65 to 74. In the National Youth Survey, self-reported voter turnout was significantly lower for the youth subgroups than for the general youth population. Self-reported turnout was lowest for Aboriginal youth and unemployed youth.
Barriers to participation
The National Youth Survey looked at the impact of specific barriers to voting among young people and considered them in terms of motivation to vote (attitudes, interest in politics, political knowledge and political influencers) and access to the electoral process (knowledge of the electoral process, personal circumstances and administrative issues).
Measuring the relative impact of all of these factors on the decision to vote, the study found that motivational barriers were slightly more important than access barriers in explaining non-voting among youth. This was a key finding of the study. The most important motivational barriers to voting were lack of political interest and knowledge; a belief that all political parties are the same, so no party speaks to issues relevant to youth; and a lesser sense that voting is a civic duty. The degree to which young people have political influencers in their lives was another significant determinant of voting behaviour. Youth who voted reported being influenced by politicians, especially if they had been contacted directly by a party or candidate, and those who discussed politics with their families, both while growing up and currently, were also more likely to vote.
The most important access barrier was lack of knowledge about the electoral process, including not knowing about the different ways to vote, followed by difficulty getting to the polling station, difficulty providing identification or proof of address and not receiving a VIC.
Overall, motivational barriers are the key reasons why fewer Canadians aged 18 to 34 vote than those in older age groups. Given the complex societal nature of these barriers, the results of the National Youth Survey suggest the need for a long-term effort among multiple stakeholders from civil society, the private sector and government to address declining youth voter turnout. In response, the Chief Electoral Officer has called for a concerted effort involving parents, educators, youth, politicians and the media to give young Canadians the tools they need to play an active role in democratic life. This effort includes supporting civic education to increase young people's knowledge about politics and democracy in Canada.
In the shorter term, Elections Canada will continue to address various access barriers. Following recommendations from the National Youth Survey, Elections Canada will focus on:
- increasing awareness about when, where and how to vote, by providing information in formats suitable for youth
- exploring ways to increase the number of electors receiving the VIC, including through targeted pre-election registration drives
- using social media to promote the VIC and inform electors about its distribution
- reviewing voter identification options (as discussed in section 1.2)
- locating polling stations where youth are likely to be
While these activities will potentially reduce the barriers associated with convenience and accessibility, it is important to note that they will not address the important motivational barriers to voting. Those require a longer-term, multi-sectoral strategy, as described above.
Return to source of Footnote 2 Currently, these groups are youth, Aboriginal electors, electors with disabilities, senior electors living in long-term care facilities, electors from ethnocultural communities and homeless electors.
Return to source of Footnote 3 More details about Elections Canada's communications campaign can be found in the Report of the Chief Electoral Officer of Canada on the 41st General Election of May 2, 2011, available on our website at www.elections.ca.
Return to source of Footnote 4 In November 2005, the Auditor General recommended that Elections Canada continue its efforts to improve the quality of its performance measures, particularly for communications and public education programs. In response, the agency established and implemented an evaluation framework in 2008 and further refined it for the 2011 general election. As a result, the amount paid to advertise the electoral reminder program in that election was reduced by $2.1 million (from $8.6 to $6.5 million) without affecting the overall recall rate.
Return to source of Footnote 5 A total of 45 respondents used the services of a community relations officer.
Return to source of Footnote 6 Electors have three options to prove their identity and address at the polls: (1) show one original authorized piece of identification with photo, name and address, issued by a government agency, such as a driver's licence; (2) show two original authorized pieces of identification; both pieces must have their name, and one must also have their address, such as a health card and a utility bill; (3) take an oath and have an elector who knows them vouch for them; this person must have authorized identification, and his or her name must appear on the voters list in the same polling division as the elector being vouched for.
Return to source of Footnote 7 In response to the ruling in the case of Hughes v. Elections Canada (Hughes v. Elections Canada 2010 CHRT 4, at 93), Elections Canada implemented procedures "for receiving, recording and processing verbal and written complaints about lack of accessibility" as well as for reporting on those complaints.
Return to source of Footnote 8 This trend has been observed by many different studies. More information is available on the Elections Canada website at www.elections.ca.
Return to source of Footnote 9 In this graph, turnout is calculated using the estimated voting age population in the denominator, not the number of electors on the final lists of electors. Using this method, the estimated national turnout rate for the 2011 election is 58.5 percent.
Return to source of Footnote 10 The study of voter turnout by age group, the Survey of Electors and the National Youth Survey can also be found on our website at www.elections.ca.
Return to source of Footnote 11 Canadians aged 18 to 24 were much less likely than the general population to recall receiving a VIC (70 percent compared with 91 percent overall).