Survey of Electors Following the 41st General Election
Appendix 2: Youth
This section focuses on youth, or electors aged 18‑24.
Most Youth Living at Home with Parent(s) at Time of Election
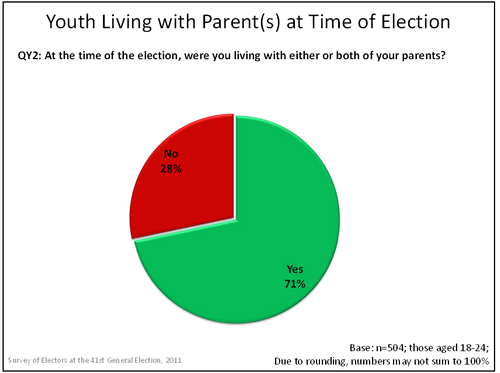
The majority (71%) of youth electors said that, at the time of the election, they were living with either or both of their parents; 28% said they were not. Statistically, youth living with their parents were not significantly more or less likely to report voting.
Youth were more likely to have moved in the last two years than were older electors (39% vs. 16%). This trend is of note as the likelihood of having voted, regardless of age, is lower amongst electors who had moved in the last two years than amongst those who had not (74% vs. 87%).
Text description of "Youth Living with Parent(s) at Time of Election" graph
Most Youth are Students, But Not Members of Student Associations
The majority (56%) of youth electors were students at the time of election. Students were more likely than non-students to report having voted (62% vs. 43%).
Of those who were students, less than a quarter (23%) were active members of a student association. Fully 77% were not members of an association. Membership in a student association did not significantly correlate with likelihood to vote.
At the time of the election (May 2nd 2011), all students surveyed were living off-campus.
Text description of "Student Status and Membership with Student Association" graph
Top Suggestion to Encourage Youth to Vote: Advertise in Schools
Youth electors were asked what, if anything, should be done to encourage youth to vote in federal elections. The top suggestion, offered by 19%, was to advertise in schools/on campus. This was followed closely by focusing on issues important to youth (17%), and better communication of issues (14%). Less than one in ten suggested offering incentives/encouragement to vote (8%), more education in schools about voting (7%), and using social media to involve youth (6%). Very few suggested online voting (2%). Suggestions offered by less than 2% of youth, categorized as "other", include providing informative material on voting procedures, using the internet and television for communication, improving the quality of candidates, and providing educational resources for students.
Youth who reported voting were more likely than those who did not to focus their suggestions on schools and education. They were more likely to suggest advertising/campaigning in schools/on campus (22% vs. 12%) and more education in schools about voting (9% vs. 4%). They were also more likely to suggest focusing on issues that are important to youth (20% vs. 12%) and using social media to get youth involved (7% vs. 2%).
The largest proportion did not offer suggestions to encourage youth to vote. Seven percent specified that nothing should be done, while a quarter said they do not know or else did not respond. Youth who did not vote were more likely not to offer suggestions (40% vs. 28% who reported voting).

Text description of "Means of Encouraging Youth to Vote" graph
