 Site Menu
Survey of Election Officers following the 41st Federal General Election
Section 4: Satisfaction with Election Materials
This section presents the overall satisfaction of officers regarding the election materials that was provided to them and the lists of electors.
Election Materials
Overall, officers were satisfied with the election materials they received, with 90% reporting that they were either fairly or very satisfied. Across regions, officers from Atlantic Provinces were more likely (95%) to be satisfied whereas officers from Alberta were significantly less likely (86%) to report being satisfied. Compared to 2008, satisfaction with election materials has increased in all regions except Ontario and Manitoba.
Q10: "How satisfied were you with the election materials that were provided to you?" By region (2011: n=3,213; 2008: n=3,115)
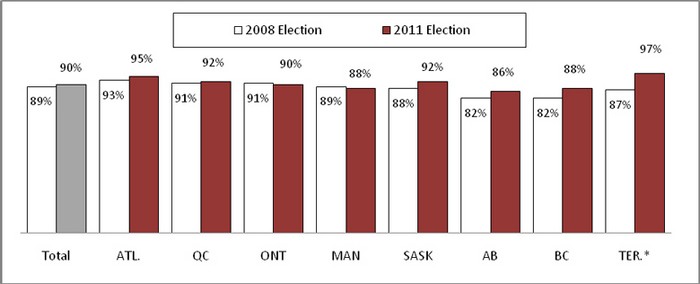
Percentage rating very/fairly satisfied (combined ratings of 1 and 2 on a 4 point scale).
*Caution should be used when interpreting results due to small sample.
Officers working in mobile polls were significantly less likely (84%) to report satisfaction with the election materials, whereas those working in ordinary polls were significantly more likely (91%) to report being satisfied. Information officers were significantly more likely (93%) to report being satisfied while central poll supervisors were the least likely (88%).
| Total | Advance | Ordinary | Mobile | CPS | DRO | IO | |
|---|---|---|---|---|---|---|---|
| Very satisfied | 57% | 54% | 58%+ | 45%- | 48%- | 57% | 63%+ |
| Fairly satisfied | 33% | 34% | 33% | 38% | 40%+ | 33% | 30% |
| Not very satisfied | 8% | 9% | 7%- | 14%+ | 10%+ | 8% | 5%- |
| Not at all satisfied | 2% | 3% | 2% | 2% | 2% | 2% | 2% |
Many reasons were mentioned for not being satisfied with the election materials. Most officers stated that the documentation was either too complicated or confusing (24%), that there was too much documentation and things to learn and read altogether (14%) or that there was too much useless documentation or paper (13%). Other opinions expressed are that the material was simply missing (11%) or that the documentation was inadequate, out-dated or incomplete (10%).
| Total | |
|---|---|
| Documentation was too complicated/confusing | 24% |
| Too much documentation/too many things to learn/read | 14% |
| Too much useless documentation/paper | 13% |
| Did not receive all material/material missing | 11% |
| Documentation was inadequate/out-dated/incomplete | 10% |
Top Answers Only.
Reasons for not being satisfied were similar across regions; however, some statistical differences were noted:
- Officers from Quebec were more likely (20%) to report that the documentation was inadequate, out-dated or incomplete;
- Officers from Ontario were less likely (5%) to report that the documentation was inadequate, out-dated or incomplete;
- Officers from British Columbia were more likely (10%) to report that materials provided were of poor quality or wouldn't work; and
- Officers from British Columbia were less likely (6%) to report that there was too much useless documentation/too many things to learn/read.
There was also variance when examining the reasons among different staffing positions:
Deputy returning officers:
- Were more likely (16%) to report that they received too much useless documentation or paper; and
- Were less likely (7%) to report that they did not receive all material or were missing material;
Central poll supervisors:
- Were more likely (21%) to report that they did not receive all materials or had materials missing;
- Were more likely (8%) to report that they didn't receive enough material;
- Were more likely (7%) to report that the material wasn't provided in a timely manner; and
- Were less likely (5%) to report that they received too much useless documentation or paper;
Information officers:
- Were more likely (11%) to report that they did not receive enough materials; and
- Were less likely (1%) to report that they received too much useless documentation.
Lists of Electors
More than 9 out of 10 (93%) deputy returning officers reported being satisfied with the lists of electors. Between the regions, officers in Ontario and Alberta were more likely to be satisfied (95%), whereas officers in Manitoba and Saskatchewan were significantly less likely to be satisfied (75% and 80% respectively).
Q12: "How satisfied are you with the lists of electors that were provided to you?" By region (n=2,104)
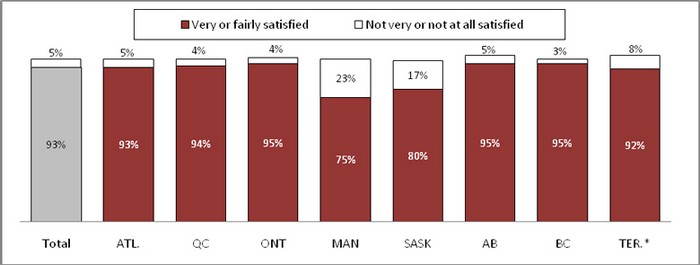
Percentage rating fairly / very satisfied (combined ratings of 1 and 2 on a 4 point scale).
Deputy returning officers only.
*Caution should be used when interpreting results due to small sample.
Officers working at mobile polls were significantly less likely (87%) to report satisfaction with the list of electors than those working in advance or ordinary polls.
| Total | Advance | Ordinary | Mobile | |
|---|---|---|---|---|
| Very satisfied | 70% | 74% | 70% | 61%- |
| Fairly satisfied | 23% | 21% | 23% | 26% |
| Not very satisfied | 4% | 5% | 4% | 10%+ |
| Not at all satisfied | 1% | 1% | 1% | 3% |
Deputy returning officers only.