 Site Menu
Survey of Electors Following the 42nd General Election
4. Elector Communication
While most respondents recalled seeing some form of official elections communications from Elections Canada, only a small minority contacted Elections Canada. Respondents were generally knowledgeable about the requirements to be registered, the means to prove identification, and the methods to cast a ballot. Respondents generally felt that they were well informed about the electoral process and its requirements, but they were less uniformly aware of Elections Canada's Online Voter Registration Service.
4.1 Observation of Official Elections Communications
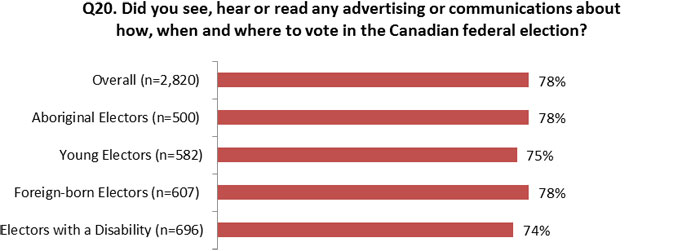
Just over three-quarters (78%) of respondents indicated that they saw, heard or read advertising related to how, when and where to vote in the election. There are no significant differences among the subgroups. However, electors with disabilities and young adults appear to be more likely to say no. (Figure 4.1) In 2011, four in ten electors (40%) said that they noticed an advertisement from Elections Canada.Footnote 9
Figure 4.1: Electors' Recall of Elections Canada Advertisement about the Election
Text description of "Electors Interest in Politics"
Base: All electors.
The top two sources of this information were traditional media (i.e., television and newspapers). Thirty percent (30%) of respondents cited their VIC (Table 4.1).
| Q21: Where did you see, hear or read about elections communications about how, when and where to vote? | Total (n=2,186) |
|---|---|
| Television | 40% |
| Newspaper | 33% |
| Voter information card (addressed to the elector) | 30% |
| Radio | 24% |
| Elections Canada householder-brochure/leaflet (received in the mail) | 8% |
| Other internet website (other than Elections Canada website) | 8% |
| Social media (including Facebook, Twitter, YouTube) | 6% |
| Signs, posters, billboards | 6% |
| Word of mouth (friends, relatives, colleagues) | 5% |
| From candidates and political parties | 5% |
| Elections Canada website | 3% |
| Other source | 2% |
| Don't know/Refusal | 2% |
Note: Percentages may sum to more than 100%, since multiple responses were accepted.
Base: Electors who saw, hear or read about how, when and where to vote.
Other factors that led to different perceptions of elector communication included:
- Aboriginal Electors: Aboriginal respondents were less prone to cite the voter information card (21%) as a source from which they heard, saw or read about voting in the election than non-Aboriginal respondents (32%).
- Age: Age was again one of the main factors determining the source of information regarding how, when and where to vote. Young adults (aged 18 to 34) were significantly less likely to have heard, read or seen these communications in newspapers (19%) and on VICs (17%) than adults aged 35 or older (39% newspapers; 34% VIC). However, young adults were also more likely to have recalled seeing these messages on signs, posters or billboards (14%) and on social media (16%) compared with adults aged 35 or older (4% and 6%).
- Income: Electors living in higher-income (>$80k) households were almost twice as likely to have heard about voting in the election on the radio (30%) than electors living in lower-income (<$40k) households (17%).
- Region: Electors living in Québec were significantly less likely to cite newspapers (23%) as a source about how, when and where to vote compared with the rest of Canada (35%). Conversely, electors living in Québec were almost as twice as likely to cite their VIC (43%) as a source of this information compared with the rest of Canada (26%). Electors from the Territories were more likely to cite radio (41%) and social media (25%) as sources of information about voting in the election when compared with other provinces (24% and 8% respectively). Finally, a larger proportion of electors living in the Territories saw election communications on signs, posters and billboards (18%) compared with other provinces (5%).
- Voting Behaviour: A higher proportion of voters saw, heard or read communications about voting in the election (79%) than non-voters (64%). Non-voters were significantly less likely to have seen, heard or read about how, when and where to vote in newspapers (28%) or on their VIC (18%) than voters (41% newspapers; 31% VIC).
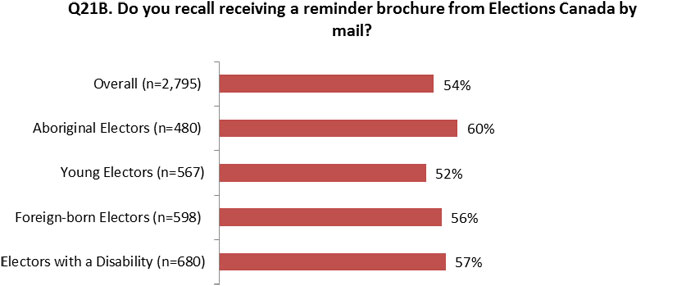
Half of electors (54%) who were aware of the 42nd federal general election recalled receiving a reminder brochure from Elections Canada in the mail. There are no significant differences among subgroups. However, Aboriginal electors appeared to recall in a greater proportion the reminder brochure (Figure 4.2). This result shows an increase in the number of elector who recalled receiving a reminder brochure from Elections Canada over both the 2011 and 2008 general elections (34% and 48% respectively).
Figure 4.2: Electors Who Received a Reminder Brochure from Elections Canada
Text description of "Electors Who Received a Reminder Brochure from Elections Canada"
Base: All electors who were aware of the 42nd federal general election.
- Aboriginal electors: Aboriginal electors appear to be more likely to recall receiving a reminder brochure from Elections Canada by mail (60%) than non-Aboriginal electors (54%).
- Income: Just over half (54%) of respondents recalled receiving a reminder brochure from Elections Canada by mail, although respondents living in higher-income (>$80k) households were less likely to recall receiving a reminder brochure from Elections Canada by mail compared with electors living in middle-income ($40k–$80k) households (50% to 62%). Lower-income (˂$40K) households were also more likely to recall receiving a reminder brochure (57%).
- Region: Electors living in Québec were more likely to recall having received a reminder brochure from Elections Canada (62%) when compared with the rest of Canada (52%).
4.2 Electors' Perception of Being Informed
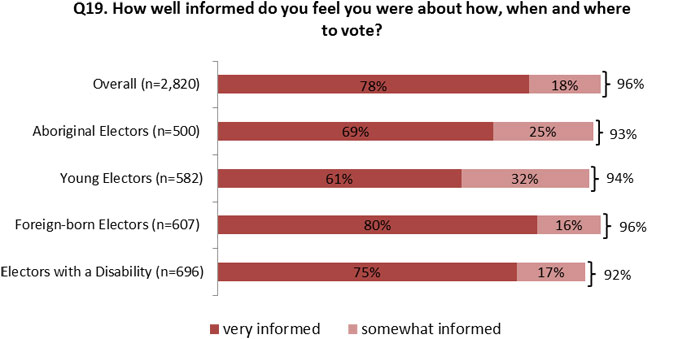
Overall, almost all respondents (96%) indicated that they felt informed about how, when and where to vote. Just under four-fifths (78%) indicated that they felt very informed, and eighteen percent (18%) felt somewhat informed. Aboriginal electors and young adults were less likely to feel well informed about the election (Figure 4.3). Only three percent (3%) did not feel very informed, and one percent (1%) of respondents indicated that they did not feel at all informed. Significant differences emerge when sorting respondents demographically.
Figure 4.3: Electors' Perception of Being Informed
Text description of "Electors' Perception of Being Informed"
Base: All electors.
- Aboriginal Electors: Aboriginal electors appear to feel less informed. While over two-thirds (69%) of Aboriginal electors indicated that they felt very informed, with an additional one-quarter (25%) feeling somewhat informed, these were lower combined rates when compared with non-Aboriginal electors, with four-fifths (81%) of non-Aboriginal electors saying they felt very informed and sixteen percent (16%) saying they felt somewhat informed.
- Age: Young adults (aged 18 to 34) were less likely to report feeling very informed compared with adults aged 35 or older (61% versus 84%) and more likely to say that they felt somewhat informed (32% versus 13%).
- Region: The Territories had a significantly smaller number of electors who reported that they felt very informed (56%) compared with other provinces (78%). Nevertheless, there is little to no difference between the overall proportion of electors from the Territories and other provinces who felt informed (100% and 96% respectively).
- Voting Behaviour: Overall, electors who voted in the 2015 election felt more informed than non-voters (98% vs 82%). Non-voters were less likely to report that they felt very informed (50%) compared with voters (82%), but were significantly more likely to say they felt somewhat informed (32%, compared with 16% of voters).
4.3 Contact with Elections Canada
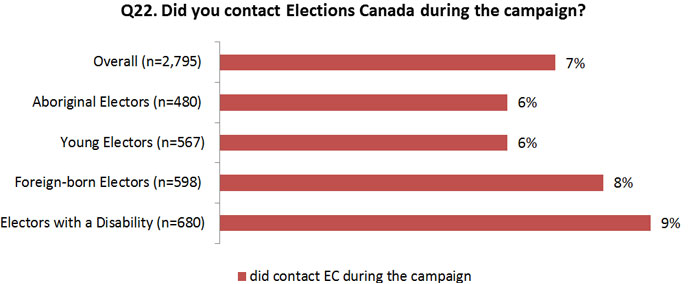
Only seven percent (7%) of respondents mentioned that they contacted Elections Canada. There are no significant differences among subgroups (Figure 4.4). These results represent a slight increase over 2011 (6%) and 2008 (4%).
Figure 4.4: Electors who Contacted Elections Canada during the Campaign
Text description of "Electors who Contacted Elections Canada during the Campaign"
Base: All electors who were aware of the 42nd federal election.
Of those who did contact Elections Canada, over four-fifths (86%) said that they were satisfied (63% very and 23% somewhat satisfied) with the information provided to them, while only eight percent (8%) of respondents who contacted Elections Canada indicated that they were not very satisfied and five percent (5%) not at all satisfied. There are no significant differences among subgroups (Figure 4.5).
Figure 4.5: Electors' Satisfaction with the Information provided by Elections Canada
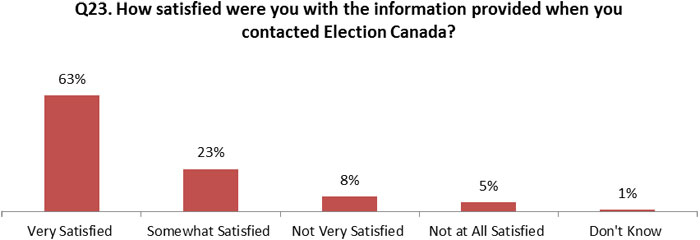
Text description of "Electors' Satisfaction with the Information provided by Elections Canada"
Base: Electors who contacted Elections Canada during the campaign (n=196).
Although few respondents contacted Elections Canada, a much larger number visited Elections Canada's website during the campaign (23%).Footnote 10 Differences were observed for Aboriginal electors, young adults and electors with a disability (Figure 4.6).
Figure 4.6: Electors Who Visited Elections Canada's Website during the Campaign
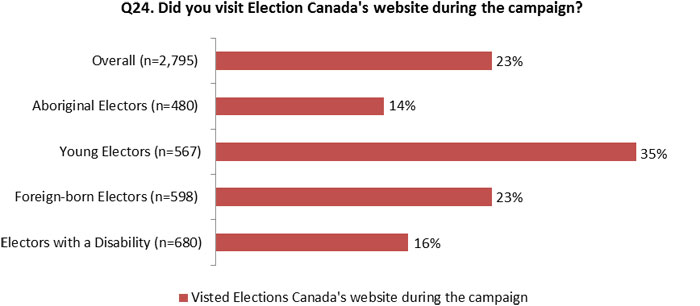
Text description of "Electors Who Visited Elections Canada's Website during the Campaign"
Base: Electors aware of the 42nd election.
- Aboriginal Electors: Aboriginal electors were less likely to say they visited the Elections Canada website during the campaign compared with non-Aboriginal electors (14%, versus 20%).Footnote 11
- Age: Young adults (aged 18 to 34) were more than twice as likely to say they visited the Elections Canada website during the campaign compared with adults aged 35 or older (35%, compared with 16%).
- Electors with a Disability: Electors with a disability were slightly less likely than electors with no disability to mention they visited the Elections Canada website during the campaign (16%, compared with 20%).
- Region: Electors living in Québec were less likely to have visited Elections Canada's website during the campaign (14%) in comparison with electors living in the rest of Canada (25%).
- Voting Behaviour: Voters were more likely than non-voters to say they visited the Elections Canada website during the campaign (24% and 14%, respectively).
Of those respondents who visited the Elections Canada website, most reported either being very satisfied (59%) or somewhat satisfied (34%) with the information provided, for a total of ninety-three percent (93%). Only a small proportion of respondents reported being not very satisfied (4%), and even fewer being not at all satisfied (1%).
4.4 Knowledge of Registration Requirements
Just under nine-tenths (88%) of respondents were aware that they needed to be registered to be able to vote in the federal election. Ten percent (10%) of respondents answered that voters did not need to be registered in order to vote, and only a small proportion (3%) were not able to recall whether voters need to be registered. There are no significant differences among subgroups (Figure 4.7).
Figure 4.7: Electors' Awareness of Registration Requirements
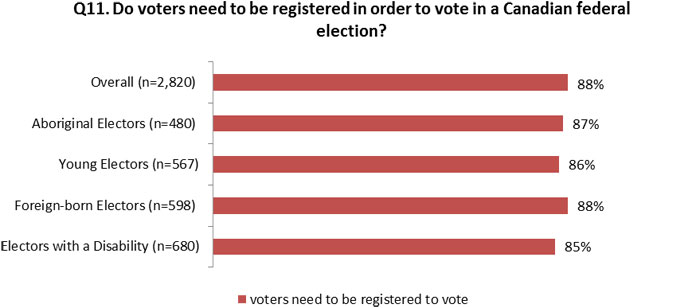
Text description of "Electors' Awareness of Registration Requirements"
Base: All electors.
Traditional media was an important source of information about registration requirements, with television again being the most frequently cited source (with 29% of respondents mentioning it) (Table 4.2). Radio and newspapers were cited approximately half as often as television (16% and 14% respectively). The VIC was also an important source of information: the second-most cited source and mentioned by one-quarter (25%) of respondents.
| Q12: From what sources do you recall hearing about whether or not electors need to be registered to vote? | Total (n=2,745) |
|---|---|
| Television | 29% |
| Voter information card (addressed to the elector) | 25% |
| Radio | 16% |
| I knew this from my past experience | 15% |
| Newspaper | 14% |
| Social media | 5% |
| 3% | |
| 1% | |
| YouTube | < 1% |
| Other social media (other than Facebook, Twitter and YouTube) | 1% |
| Word of mouth (friends, relatives, colleagues) | 8% |
| Elections Canada householder-brochure / leaflet (received in the mail) | 6% |
| Other internet website (other than Elections Canada website) | 4% |
| When I voted | 2% |
| Elections Canada website | 2% |
| Tax forms | 2% |
| School | 2% |
| From candidates and political parties | 1% |
| Elections Canada (revising agents, phone) | 1% |
| General knowledge | 1% |
| Other sources | 8% |
| Don't know/ Refusal | 8% |
Note: Percentages may sum to more than 100%, since multiple responses were accepted.
Base: All electors who were aware of the registration requirement.
- Age: Among the electors who were aware of the registration requirements, young adults (aged 18 to 34) were more likely to cite social media (18%) as a source from which they recall hearing about the registration requirement compared with adults aged 35 or older (8%). Young adults were less likely than older adults to cite television (19%, compared with 32%) and newspapers (3%, compared with 17%) as sources of information about registration requirements, instead relying more on word of mouth than did older adults (18%, compared with 4%).
- Region: Electors living in the province of Québec were more likely to recall hearing about the registration requirement from their VIC (33%) than did electors living in the rest of Canada (23%).
4.5 Knowledge of Online Voter Registration Service
Approximately half (51%) of the respondents surveyed thought that the Online Voter Registration Service on the Elections Canada website could be used to check, update or complete their voter registration during the election. Differences were observed for Aboriginal electors and younger adults (Figure 4.8). Significantly, thirty-two percent (32%) indicated that they did not know whether that could be done, suggesting a general lack of familiarity with the service.
Figure 4.8: Electors' Awareness of Online Voter Registration Service on Election Canada's Website
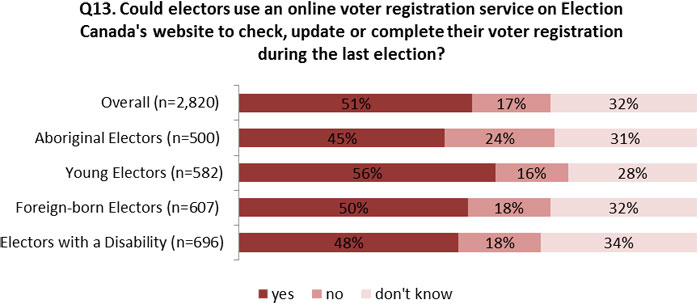
Base: All electors.
- Aboriginal Electors: Aboriginal electors were slightly less likely to be aware of the Online Voter Registration Service than non-Aboriginal electors (45%, compared with 49%).
- Age: Young voters were more likely to be aware of the Online Voter Registration Service than voters aged 35 or older (56%, compared with 47%).
Television was the most-cited place where respondents who knew about the Online Voter Registration Service had heard about it (30%). This proportion was double that of radio, the next-most-cited source, at fifteen percent (15%) (Table 4.3).
| Q13A: From what sources do you recall hearing about online registration? | Total (n=1,437) |
|---|---|
| Television | 30% |
| Radio | 15% |
| Voter information card (addressed to the elector) | 13% |
| Word of mouth (friends, relatives, colleagues) | 12% |
| Newspaper | 11% |
| Social media (including Facebook, Twitter, YouTube) | 8% |
| Other internet website (other than Elections Canada website) | 7% |
| Elections Canada householder-brochure/leaflet (received in the mail) | 6% |
| Elections Canada website | 6% |
| From candidates and political parties | 1% |
| From working for Elections Canada | 1% |
| From past experiences | 1% |
| Other sources | 7% |
| Don't know | 13% |
Note: Percentages may sum to more than 100%, since multiple responses were accepted.
Base: Electors who are aware of the Online Voter Registration Service on Elections Canada's website.
- Age: Again, young adults (aged 18 to 34) were less likely than adults aged 35 or older to have heard about the Online Voter Registration Service from television (20%, compared with 36%) and from newspapers (1%, compared with 17%). However, television was still the first source of information from which young adults were more likely to have heard about the Online Voter Registration Service.
- Region: Electors from Québec were significantly less likely to cite radio (7%) as a source from which they heard about the Online Voter Registration Service compared with electors in the rest of Canada (17%). Meanwhile, electors from Québec were more likely to cite the VIC (25%) as a source for this information than the rest of Canada (10%).
4.6 Knowledge of Voting Methods
Nine in ten (90%) respondents indicated that they thought one could vote in person at the polling station on election day , while just under two-thirds (64%) mentioned that one could vote at an advance polling station (Table 4.4). Thirteen percent (13%) of respondents also said that one could vote by mail (either within Canada or abroad). Eleven percent (11%) of respondents thought that one could cast their vote online, and 2% that they could vote by proxy, despite that not being the case at the federal level.
| Q14: To the best of your knowledge, what are the current ways that electors can vote in a federal election? | Total (n=2,820) |
|---|---|
| In person at a polling station on election day | 90% |
| At an advance polling station | 64% |
| By mail (either within Canada or outside Canada) | 13% |
| Online [does not exist at the federal level] | 11% |
| At a local Elections Canada office | 3% |
| By proxy [does not exist at the federal level] | 2% |
| Through a visiting Elections Canada officer | 1% |
| By phone | 1% |
| At home | 1% |
| Other, please specify | 4% |
| Don't know/Refusal | 4% |
Note: Percentages may sum to more than 100%, since multiple responses were accepted.
Base: All electors.
- Aboriginal Electors: Aboriginal respondents were less inclined to mention voting in person at a polling station (75%) or at an advance poll (42%) as a way to vote in a federal election than non-Aboriginal respondents (90% and 67%, respectively).
- Age: Young adults (aged 18 to 34) were less likely to cite advance polling stations (46%) as a way that electors can vote in a federal election compared with adults aged 35 or older (69%).
- Electors with a Disability: Electors with a disability were less likely than electors with no disability to mention the possibility of voting in person during election day (79%, compared with 92%) or at an advance poll (54%, versus 68%).
- Income: Household income is related to the degree of awareness of voting procedures, with electors from higher-income (>$80k) households more aware of the option to vote in person at a polling station (94%) compared with voters from lower-income (<$40k) households (84%). This relationship also shows up in voters' awareness that they can use an advance polling station, with nearly three-quarters (74%) of higher-income (>$80k) respondents mentioning this option compared with lower citation rates for middle-income ($40k–$80k) and lower-income (<$40k) electors (63% and 51%, respectively). This relationship between income brackets was still present for other voting options; however, the difference was not as pronounced as with the two options cited above.
- Voting Behaviour: Finally, respondents who did not vote in the 2015 federal election were less aware of the different voting options available to voters. Electors who did not vote were less aware of the option to vote in person during election day compared with voters (76% versus 92%), with an even greater disparity between the two groups when looking at the option of voting at an advance poll (39%, versus 68%).
Once again, television was the primary source of information for respondents regarding different available voting methods, with just under one-third (31%) mentioning it as a source (Table 4.5). The VIC was an important source for this information, being mentioned by twenty-one percent (21%) of respondents, about as much as for radio (20%). The internet does not appear to be a major source of information on voting methods, as the top internet-based selections were other internet websites (other than Elections Canada) and social media, each of which were mentioned by only five percent (5%) of respondents. This was followed by the Elections Canada website, at three percent (3%).
| Q15: From what sources do you recall hearing about the different ways to vote? | Total (n=2,448) |
|---|---|
| Television | 31% |
| Voter information card (addressed to the elector) | 21% |
| Radio | 20% |
| Newspaper | 17% |
| I knew this from my past experience | 13% |
| Word of mouth (friends, relatives, colleagues) | 11% |
| Elections Canada householder-brochure/leaflet (received in the mail) | 5% |
| Other internet website (other than Elections Canada website) | 5% |
| Social media (including Facebook, Twitter, YouTube) | 5% |
| Elections Canada website | 3% |
| From candidates and political parties | 2% |
| When I voted | 1% |
| Other Sources | 8% |
| Don't know/Refusal | 7% |
Note: Percentages may sum to more than 100%, since multiple responses were accepted.
Base: Electors who are aware of the current ways to vote in a federal election.
- Age: Television, word of mouth and newspapers correlated positively with age, with fewer young adults (aged 18 to 34) citing these sources (23% television; 7% newspapers) compared with adults aged 35 or older (37% television; 23% newspapers). Word of mouth was three times more likely to be cited by young adults as a source of information about the various ways to vote when compared with older adults (24% versus 7%).
- Gender: Women were more likely than men to mention the VIC as a source of information on how to vote in the election, with a higher proportion of female electors recalling reading about the different ways to vote from their VIC (27%) compared with male electors (17%).
- Region: Electors living in the Territories were significantly less likely to recall having heard about the different ways to vote from television (16%) and the VIC (6%) when compared with other provinces (34% and 23% respectively).Footnote 12
- Voting Behaviour: Electors who did not vote were less likely than voters to cite television (35%, versus 24%) and more likely than voters to cite word of mouth (22%, compared with 11%) as a source from which they heard about the different ways to vote.
4.7 Knowledge of Identification Requirements
Almost all respondents (97%) indicated that they were aware that electors had to present proof of identity in order to vote. This is unchanged since 2011, but it represents a three percentage point increase from 2008, when ninety-four percent (94%) of electors said they were aware of the proof-of-identity requirements.
Although the majority of respondents (88%) indicated that they were aware that electors had to present proof of address in order to vote in the election, the awareness level of the proof-of-address requirement is lower than for the proof of identity (Table 4.6). A small proportion (6%) of electors indicated that voters did not have to present a proof of address to vote and another six percent (6%) simply did not know whether voters had to show a proof of address. Again, the proportions of electors who are aware of the proof-of-address requirements remain almost unchanged since 2011 (89%), when it slightly surpassed the eighty-five percent (85%) observed in the 2008 general election.
| Socio-demographic characteristics | Elector awareness of proof-of identity-requirement (% aware) | Elector awareness of proof-of-address requirement (% aware) |
|---|---|---|
| Aboriginal Electors (n=480) | 94% | 89% |
| Young Electors (n=567) | 96% | 87% |
| Foreign-born Electors (n=598) | 97% | 83% |
| Electors with a Disability (n=680) | 96% | 87% |
| Low Income < $40K (n=562) | 96% | 85% |
| Middle-Income $40K - $80K (n=759) | 97% | 90% |
| High Income > $80K (n=1,090) | 98% | 89% |
| Non-voters (n=283) | 91% | 79% |
| Overall (n=2,820) | 97% | 88% |
Source: Survey of the 42nd General Election – Questions 16 and 17.
Base: All electors.
- Aboriginal electors: There was an increase in the awareness of the identification requirement among Aboriginal electors. Awareness of the identity requirement for Aboriginal electors increased from eighty-four percent (84%) in 2008 and eighty-seven percent (87%) in 2011 to ninety-four percent (94%) in 2015. The same can be said for the awareness of the proof-of-address requirement, which increased from seventy-one percent (71%) in 2008 and 79% in 2011 to eighty-nine percent (89%) in 2015.
- Voting Behaviour: Non-voters were less aware of the proof-of-address requirement (79%) than voters (90%). This was also observed in 2008 (81% of non-voters, compared with 87% of voters) and in 2011 (78% of non-voters, compared with 91% of voters).
The most-cited source of this information was the VIC, which was mentioned by thirty-one percent (31%) of respondents (Table 4.7). Past experience was the second-most-cited source of information about the proof-of-identity and proof-of-address requirements, with twenty-two percent (22%) of respondent mentions. There has been a slight decrease in the proportion of electors who identified the VIC (41%) and experience (36%) as a source of information about the voter identification requirements since 2011 (42% and 38% respectively). However, the result of the 2015 survey still shows a higher proportion of electors who used these two sources of information than what was observed in 2008 (27% for the VIC and 6% from past experience). The Elections Canada website was the most frequently mentioned online resource, at four percent (4%).
| Q18: From what sources do you recall hearing about [the proof-of-identity and proof-of-address requirements]? | Total (n=2,768) |
|---|---|
| Voter information card (received in the mail) | 31% |
| I knew this from my past experience | 22% |
| Television | 21% |
| Radio | 13% |
| Newspaper | 11% |
| When I voted | 8% |
| Word of mouth (friends, relatives, colleagues) | 7% |
| Elections Canada householder-brochure/leaflet (received in the mail) | 7% |
| Elections Canada website | 4% |
| Other internet website (other than Elections Canada website) | 3% |
| Social media (including Facebook, Twitter, YouTube) | 3% |
| From candidates and political parties | 1% |
| Other source | 8% |
| Don't know/Refusal | 5% |
Note: Percentages may sum to more than 100%, since multiple responses were accepted.
Base: Electors who are aware of proof-of-identity or proof-of-address requirements.
- Aboriginal Electors: Aboriginal electors were found to be less likely to cite the VIC as a source of information about identification requirements for the 2015 election than non-Aboriginal electors (20% versus 32%).
- Age: Television, word of mouth, and newspapers correlated positively with age. Fewer young adults (aged 18 to 34) cited these sources (10% television; 1% newspapers) than adults aged 35 or older (25% television; 16% newspapers). Word of mouth was more commonly cited by young adults as a source of information about identification requirements compared with older adults (16%, versus 4%).
- Gender: Female electors were more likely than male electors to recall learning about the identification requirements from their VIC (37%, compared with 25%). However, the VIC was still the main source of information about identification requirements for both male and female electors.
- Region: Electors living in the Territories were less likely to say that they recall learning about identification requirements from their VIC (15%, versus 31% for other provinces) and more likely to say they heard about the requirement from social media (14%, versus 3% for other provinces). Since the number of respondents from the Territories is small, these results should be interpreted with caution.
- Voting Behaviour: Electors who did not vote during the past general election were less likely to mention the VIC (16%) as a source of information about identification requirements than voters (33%).
Return to source of Footnote 9 It is hazardous to compare the 2015 findings with previous studies because the measurement approach changed in 2015. In the 2011 survey, respondents were asked if they had noticed an Elections Canada ad during the campaign; there was no question on that subject in the 2008 survey. In the 2015 survey, respondents were asked if they had seen, heard or read any advertising or communication about how, when and where to vote in the Canadian federal election.
Return to source of Footnote 10 This question was introduced in the survey on the 42nd election.
Return to source of Footnote 11 Results of subgroup analysis are not weighted by age. This is the reason why the proportion of non-Aboriginal electors who say they visited Elections Canada's website is smaller than the proportion of the overall population.
Return to source of Footnote 12 Only thirty-six (36) respondents from the Territories answered this question. Results should be interpreted with caution.