 Site Menu
Turnout by Province and Territory – Estimation of Voter Turnout by Age Group and Gender at the 2021 General Election
Prince Edward Island had the highest turnout, and Nunavut the lowest, among all provinces and territories
Figure 10 shows how voter turnout by province and territory compares with the range of turnout rates for all elections since 2004.
- The grey line indicates the average turnout for elections from 2004 to 2021, inclusive
- The upward pointing triangle indicates the highest turnout rate for a given province/territory in the same timeframe
- The downward pointing triangle indicates the lowest turnout rate
- The circle and the numeric label indicate the results for the 44th general election; when the circle overlaps with a triangle, the result reached a high or low point in the 20042021 period
Figure 10: Voter Turnout by Province/Territory, General Elections 2004 to 2021 
Text version of "Figure 10: Voter Turnout by Province/Territory, General Elections 2004 to 2021"
Figure 10: Voter Turnout by Province/Territory, General Elections 2004 to 2021 Province / Territory Turnout Minimum Maximum Year of Minimum Year of Maximum Turnout Newfoundland and Labrador 52.4% 48.1% 53.7% 59.9% 40th GE, 2008 42nd GE, 2015 Prince Edward Island 72.8% 71.0% 74.3% 80.0% 40th GE, 2008 42nd GE, 2015 Nova Scotia 64.6% 59.4% 64.6% 71.4% 38th GE, 2004 43rd GE, 2019 New Brunswick 65.2% 62.9% 67.4% 73.3% 40th GE, 2008 42nd GE, 2015 Quebec 64.0% 60.6% 64.2% 67.8% 38th GE, 2004 43rd GE, 2019 Ontario 61.4% 55.5% 61.2% 66.4% 40th GE, 2008 43rd GE, 2019 Manitoba 61.6% 54.1% 59.7% 65.8% 40th GE, 2008 42nd GE, 2015 Saskatchewan 63.7% 56.8% 63.0% 71.4% 40th GE, 2008 43rd GE, 2019 Alberta 62.9% 49.4% 59.5% 68.6% 40th GE, 2008 43rd GE, 2019 British Columbia 61.2% 55.4% 60.6% 68.2% 40th GE, 2008 42nd GE, 2015 Yukon 62.7% 55.5% 64.0% 74.2% 38th GE, 2004 42nd GE, 2015 Northwest Territories 44.0% 44.0% 49.4% 60.9% 44th GE, 2021 42nd GE, 2015 Nunavut 29.4% 29.4% 42.3% 53.1% 44th GE, 2021 42nd GE, 2015
In the 2021 general election, Prince Edward Island saw the highest turnout at 72.8%, and Nunavut the lowest at 29.4%, which is the lowest recorded turnout for this territory since 2004. Turnout was about or below average for most provinces and territories, with the exception of Alberta (62.9%, above average) and the Northwest Territories (44%, historical minimum).
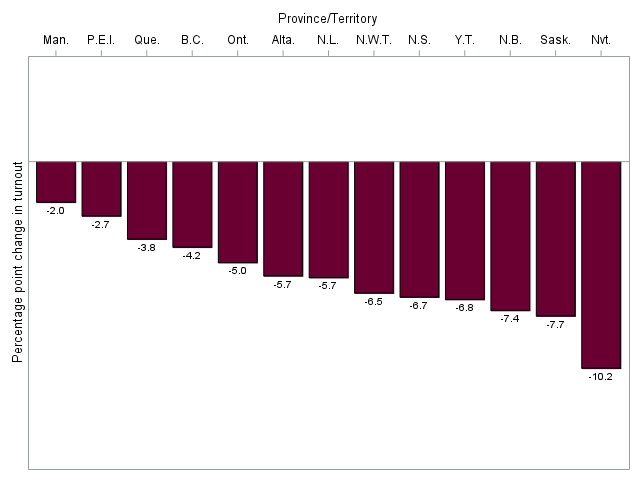
Text version of "Figure 11: Change in Voter Turnout by Province/Territory between the 2019 and 2021 General Elections"
| Province / Territory | Difference in percentage points |
|---|---|
| Newfoundland and Labrador | -5.7 |
| Prince Edward Island | -2.7 |
| Nova Scotia | -6.7 |
| New Brunswick | -7.4 |
| Quebec | -3.8 |
| Ontario | -5.0 |
| Manitoba | -2.0 |
| Saskatchewan | -7.7 |
| Alberta | -5.7 |
| British Columbia | -4.2 |
| Yukon | -6.8 |
| Northwest Territories | -6.5 |
| Nunavut | -10.2 |
Figure 11 shows how turnout changed within provinces and territories between the general election of 2019 and that of 2021.
In the 2019 election, turnout reached a high point for most provinces, and in 2021 all provinces and territories registered a decrease, reaching double digits (minus 10.2 percentage points) for Nunavut. This is the second general election in a row in which Nunavut experienced a double-digit dip in turnoutin 2019, Nunavut saw a decrease of minus 13.4 percentage points from the 2015 result.
Table 3 show the complete dataset of voter turnout by province or territory by age and gender for the 2021 general election. Table 4 shows the total turnout by age and gender for Canada.
| Age and Gender | N.L. | P.E.I. | N.S. | N.B. | Que. | Ont. | Man. | Sask. | Alta. | B.C. | Y.T. | N.W.T. | Nvt. |
|---|---|---|---|---|---|---|---|---|---|---|---|---|---|
| 1st time* | 29.0% | 42.9% | 46.2% | 41.5% | 59.2% | 45.8% | 44.0% | 41.5% | 49.3% | 44.8% | 31.3% | 24.9% | 7.4% |
| not 1st time* | 34.7% | 47.4% | 52.8% | 48.2% | 53.7% | 51.6% | 47.4% | 45.6% | 51.8% | 50.9% | 42.5% | 27.1% | 15.7% |
| 1824 | 33.2% | 46.3% | 51.1% | 46.4% | 55.1% | 50.1% | 46.5% | 44.5% | 51.1% | 49.3% | 39.6% | 26.5% | 13.4% |
| 2534 | 40.1% | 64.9% | 58.5% | 54.9% | 57.2% | 54.5% | 52.8% | 56.0% | 59.0% | 56.1% | 66.6% | 45.7% | 27.3% |
| 3544 | 48.4% | 73.5% | 62.0% | 63.5% | 62.2% | 59.2% | 59.2% | 63.0% | 62.2% | 59.6% | 65.0% | 47.0% | 31.6% |
| 4554 | 53.3% | 77.4% | 65.6% | 66.9% | 66.6% | 64.4% | 64.9% | 67.1% | 67.6% | 62.7% | 66.3% | 51.2% | 39.0% |
| 5564 | 61.8% | 84.4% | 74.0% | 74.1% | 71.7% | 68.4% | 71.5% | 73.1% | 71.5% | 67.4% | 69.6% | 53.2% | 44.0% |
| 6574 | 68.3% | 86.8% | 79.7% | 79.1% | 77.8% | 73.8% | 77.8% | 79.3% | 75.3% | 74.4% | 75.6% | 52.5% | 48.8% |
| 75+ | 58.5% | 78.1% | 66.9% | 69.1% | 64.4% | 63.5% | 68.4% | 68.9% | 65.0% | 62.9% | 71.7% | 48.5% | 45.8% |
| Women+ | 54.2% | 74.9% | 66.9% | 66.9% | 66.0% | 62.6% | 63.3% | 65.1% | 64.8% | 62.7% | 65.9% | 46.6% | 31.1% |
| 1st time* | 24.6% | 41.3% | 37.3% | 36.8% | 50.1% | 39.3% | 37.2% | 38.1% | 43.4% | 37.2% | 30.5% | 15.5% | 4.2% |
| not 1st time* | 29.1% | 39.8% | 41.2% | 40.8% | 44.9% | 44.4% | 41.1% | 41.5% | 45.5% | 42.6% | 30.6% | 19.8% | 10.6% |
| 1824 | 27.9% | 40.2% | 40.2% | 39.8% | 46.3% | 43.1% | 40.0% | 40.6% | 44.9% | 41.2% | 30.6% | 18.8% | 8.8% |
| 2534 | 34.9% | 58.2% | 49.5% | 48.4% | 50.5% | 49.3% | 48.5% | 52.2% | 53.0% | 49.3% | 53.9% | 36.4% | 19.8% |
| 3544 | 45.0% | 70.2% | 58.2% | 60.1% | 57.4% | 57.1% | 56.5% | 61.3% | 58.8% | 57.1% | 61.3% | 42.5% | 28.3% |
| 4554 | 47.9% | 73.6% | 61.4% | 63.6% | 62.3% | 62.9% | 62.1% | 64.2% | 64.1% | 61.5% | 63.9% | 50.1% | 36.2% |
| 5564 | 56.9% | 81.7% | 69.9% | 70.7% | 67.4% | 66.2% | 68.2% | 69.8% | 68.0% | 64.4% | 62.5% | 49.1% | 43.2% |
| 6574 | 66.6% | 83.1% | 77.6% | 78.0% | 75.4% | 73.3% | 76.0% | 77.5% | 73.9% | 73.3% | 69.2% | 47.4% | 50.7% |
| 75+ | 61.1% | 76.0% | 69.5% | 69.5% | 68.1% | 67.5% | 70.1% | 69.9% | 68.2% | 66.3% | 71.2% | 46.1% | 50.3% |
| Men+ | 50.5% | 70.5% | 62.2% | 63.3% | 61.9% | 60.1% | 59.8% | 62.3% | 61.1% | 59.7% | 59.5% | 41.4% | 27.7% |
| Age / Gender | 1st time* | not 1st time* | 1824 | 2534 | 3544 | 4554 | 5564 | 6574 | 75+ | All |
|---|---|---|---|---|---|---|---|---|---|---|
| Women+ | 48.3% | 51.3% | 50.5% | 55.8% | 60.5% | 65.0% | 69.8% | 75.6% | 64.3% | 63.8% |
| Men+ | 41.3% | 43.7% | 43.1% | 49.9% | 57.5% | 62.5% | 66.7% | 74.3% | 67.7% | 60.6% |
*The "1st time" category includes youth eligible to vote federally for the first time. For the 2021 general election, this includes those born between October 22, 2001, and September 20, 2003. The category "not 1st time" includes those youth under 25 years old who were previously eligible to vote federally. This includes those born between September 21, 1996, and October 21, 2001.
**The "Men+" category includes all men and some gender X electors. The "Women+" category includes all women and some gender X electors.