 Site Menu
Public Opinion Survey Following the March 19th, 2012 By-election in Toronto–Danforth (Ontario)
VOTING IN THE BY-ELECTION
This section explores issues related to voting in the March 19th, 2012 by-election.
Large Majority Claim to Have Voted in By-election
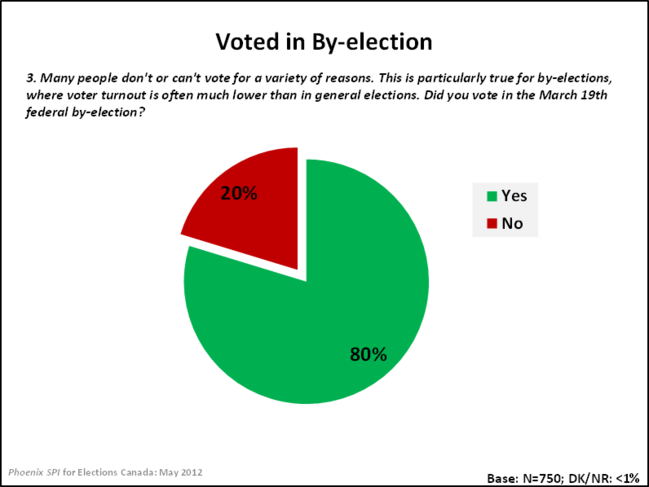
Four in five (80%) respondents claimed that they voted in the March 19th by-election.Footnote 7 Conversely, one in five (20%) said they did not.
Text description of "Voted in By-election"
Sociodemographic differences
The likelihood of having voted in the by-election increased with age, from 56% of 18-24 year olds to 85% of those 65 and older. In addition, the following were more apt to say that they have voted in the by-election: electors born in Canada (83% vs. 72% of those born outside Canada), those with a university degree (83% vs. 73% of college-educated electors), and respondents with household incomes of $100,000 or more (84% vs. 70% of those earning less than $40,000 per year).
End of boxHigher Percentage Reported Voting in 2011
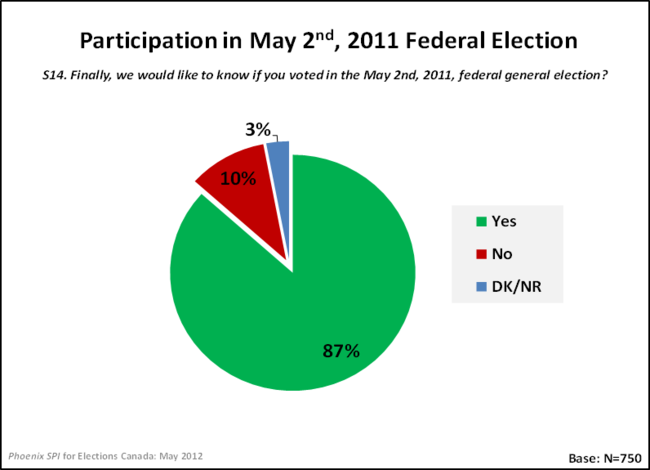
Electors were also asked if they had voted in the previous 2011 general election. A comparison of both electoral events, taken from the same sample of electors in Toronto–Danforth, shows that the self-reported voter turn-out for the 2011 general election (87%) is higher than that of this by-election (80%).
Text description of "Participation in May 2nd, 2011 Federal Election"
Duty, Followed by Habit Main Reason for Voting
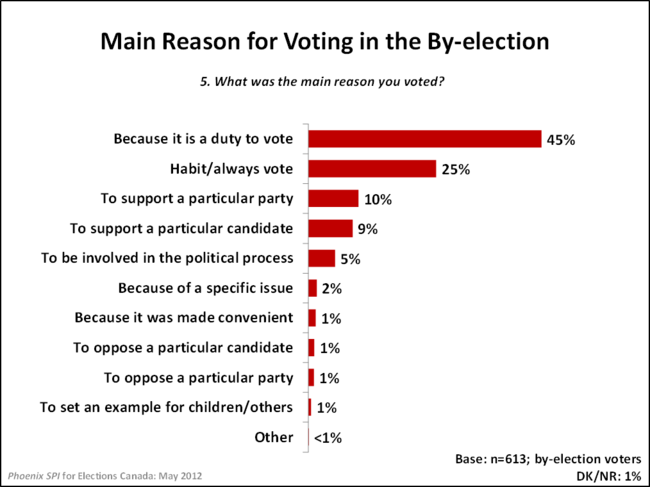
Respondents who said they voted in the by-election (n=613) were asked to identify the main reason why they voted. Non-political reasons were most often cited, including the duty to vote (45%) and the habit of voting (25%). Other reasons were more political in nature, such as supporting a particular party (10%) or candidate (9%), or to be involved in the political process (5%).
Text description of "Main Reason for Voting in the By-election"
Sociodemographic differences
Electors with household incomes of $100,000+ were more likely to vote out of duty (49% vs. 29% of respondents who have annual household incomes between $40,000 and $60,000 and 38% of those earning less than $40,000). For their part, respondents born in Canada were more likely than those born outside of Canada to have voted out of habit (27% vs. 18%).
End of boxDaily Life Issues Main Reasons for Not Voting
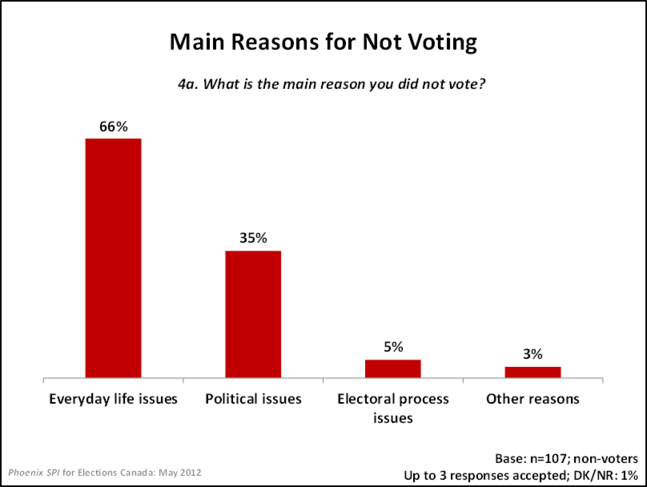
A majority of the respondents who said they were unable to vote in the by-election (n=107) pointed to everyday life issues (66%) to explain why they did not vote. In fact, these reasons were cited almost twice as often as any other types of reasons.
Text description of "Main Reasons for Not Voting"
Following this, 35% identified political issues, and 5% cited issues related to the electoral process itself (3% pointed to some other reason).Footnote 8 Generally speaking, these results are somewhat similar to that of the 2011 general election.
| Everyday Life IssuesFootnote 9 | |
|---|---|
| Too busy | 19% |
| Travelling | 18% |
| Health/injury/illness | 11% |
| Family obligations | 8% |
| Work | 7% |
| In the process of moving/changing address | 6% |
| Lack of information | 5% |
| Forgot to vote | 4% |
| Transportation issues | 1% |
| Political Issues | |
| Lack of interest/apathy | 13% |
| Related to candidates/undecided on who to vote for | 11% |
| Meaninglessness of vote | 8% |
| Related to political parties | 3% |
| Cynicism | 3% |
| Political Issues (Cont'd.) | |
| Lack of competition / Didn't think that it would make an impact | 1% |
| Related to politicians (in general) | <1% |
| Related to government | <1% |
| Electoral Process Issues | |
| Lack of information on voting process (e.g. when/where to vote) | 2% |
| Problems with access to the polls | 2% |
| Registration problems | 1% |
| No documents to prove identification when voting | <1% |
| Polling station too far away from home | <1% |
Suggestions to Encourage Non-Voters to Vote
Respondents who did not vote in the by-election (n=107) were also asked to identify what, if anything, could be done to encourage them to vote in the next federal election. In response, 30% did not offer any suggestions, while 21% said that nothing could be done to encourage non-voters to vote. Among those who did offer substantive feedback, the top suggestion, mentioned by 25% of respondents, was the ability to vote online. On that subject, it must be reminded that this suggestion is based on the opinion of 24 respondents. As a reference point, this suggestion was mentioned by 14% of Canadian electors in the 2011 general election (n=69). All other suggestions were mentioned by less than one in ten electors.
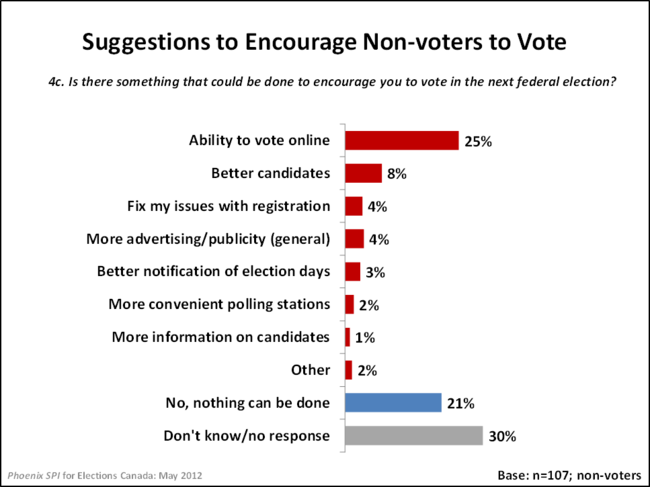
Text description of "Suggestions to Encourage Non-voters to Vote"
Most Non-Voters Claimed They Would Have Voted Online
When non-voters were asked directly if they would have voted on the Internet using the Elections Canada Web site, if it would have been possible to do so, more than two-thirds (68%) said they would have voted in this manner.
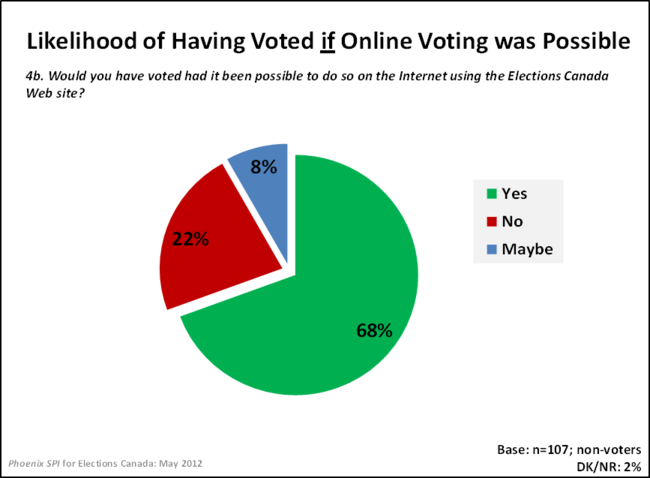
Text description of "Likelihood of Having Voted if Online Voting was Possible"
Return to source of Footnote 7 Official voter turn-out in the by-election was 43%. When interpreting these results, therefore, it is important to keep in mind that 1) non-voters are more likely to refuse answering surveys about elections, and 2) social desirability may lead to over-reporting of voting behaviour.
Return to source of Footnote 8 Percentages in the graph exceed 100% because respondents were able to provide multiple responses.
Return to source of Footnote 9 The percentages for the various items may not sum to the totals in the previous graph for each summary category for the following reasons: 1) rounding; 2) the inclusion of issues identified by very small numbers (<1%), and; 3) respondents who identified more than one issue within a summary category are only counted once when the aggregate results are presented.