 Site Menu
Explaining the Turnout Decline in Canadian Federal Elections: A New Survey of Non-voters
4. Political Interest
Table 21 "Generally speaking, how interested are you in politics?"
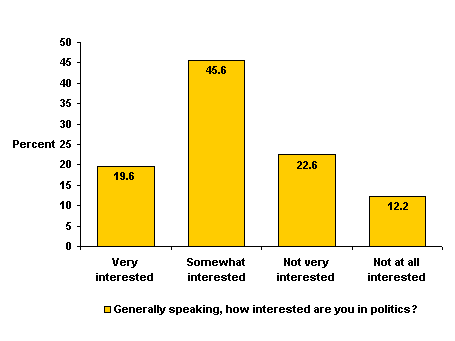
Table 22 "And how interested were you in the 2000 federal
election, held in November of that year?"
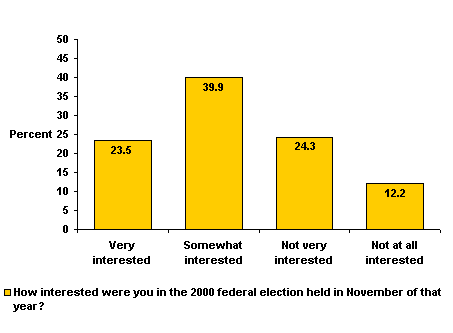
We have seen above that political interest and civic duty are related to each other, and that they both load on a common factor (Table 15). In the regressions reported in tables 17 to 20, this factor is one of the strongest predictors of voting in the elections since 1993. As we can see from tables 21 and 22, however, the overall levels of political and election interest in our 2002 survey are not particularly low in absolute terms. As it happens, the political and election interest questions are two that were asked of the entire sample, including the screening interview, and so we have a very large sample size and low margin of error for these two variables (tables 21 and 22). The overall levels of general and election interest are very similar to each other, with a few more people in the "very interested" category on election interest, and correspondingly fewer in the "somewhat interested category".
Political and election interest have been measured in all the Canadian National Election Studies, albeit in different ways. In the early surveys, the scale was a three-point measure of "how much attention" the respondent paid to politics in general "when there is not a big election campaign going on," and a four-point measure of how much attention was paid to the election in question. These surveys, in 1979 and 1984, for instance, show consistently that election interest is higher than general political interest, illustrating the stimulus effect of an election campaign. In those years, about one third of the electorate claimed to be "very interested" in the election, another 40 percent "somewhat interested" and the remainder of just under 30 percent either "slightly interested" or "not interested". General political interest measures show about 40 percent of the electorate admitting they have little or no interest, with the majority of the rest in the "follow politics fairly closely" category, rather than claiming to be very close followers of political news and events. The 2000 Canadian National Election Study measured political and election interest on a 10-point scale, on which the mean for election interest was 6.39 and general political interest 5.47. The 1997 CNES interest levels, also measured on a 10-point scale, were 5.81 for election interest and 5.38 for general political interest. These results are very similar to the overall levels of interest found in the 2002 survey under examination here.
Table 23 Interest in 2000 Election and Politics Generally
| Total | Non-voters only | |
|---|---|---|
| Interested* in both politics and election | 56.3 |
22.8 |
| Not interested? in either | 27.5 |
54.2 |
| Interested in politics, but not election | 9.0 |
18.4 |
| Interested in election, but not in politics | 7.2 |
4.5 |
| N = | 5,544 |
1,083 |
| *
= "very" or "fairly" interested † = "not very" or "not at all" interested |
||
Table 23 summarizes the national picture of political and election interest. It shows that over half (56.3 percent) of the electorate claims to have been reasonably interested (at least "fairly") in both politics in general and the 2000 election. A group of over a quarter of the citizens (27.5 percent) has low interest in both. The remaining figures are the 9 percent who were interested in politics but not in the election, and the 7 percent who had the reverse pattern of attitudes.
The picture changes substantially, however, when we isolate the interest levels of those respondents who did not vote in 2000. Over half of this group (54.2 percent) says they were not interested in either politics generally or the election specifically. A further 18.4 percent were interested in politics but not in the election, an indicator perhaps that the specific aspects of the election, perhaps the perceived non-competitive situation, led some people to consider that paying attention to the election campaign, and participating themselves, would not be worthwhile. In Table 23, the most intriguing is that group of people who were interested in politics and the election, but who did not vote, despite that interest. Table 24 takes a closer look at the reasons they gave for not voting.
Table 24 Main Reasons for Not Voting of Those Interested in Politics and the Election (First response only)
Lack of interest |
Percent |
|---|---|
| Not interested; didn't care; apathy |
6.9
|
| Vote meaningless; doesn't count; election foregone conclusion |
7.3
|
| Forgot; unaware |
1.9
|
|
16.1
|
Negativity |
Percent |
|---|---|
| No appealing candidates/parties/issues |
16.7 |
| Lack of faith/confidence in candidates/parties/leaders |
7.2 |
| Lack of information about candidates/parties/issues |
4.1 |
|
28.0 |
Personal/Administrative |
Percent |
|---|---|
| Too busy with work/school/family |
19.2 |
| Away from riding/province/country |
13.2 |
| Registration problems |
7.9 |
| Illness, health issues |
3.4 |
| Didn't know where or when; polling station problems |
6.3 |
| Moving-related problems |
1.9 |
|
51.9 |
Other |
Percent |
|---|---|
| Religious reasons |
0.6 |
| Other; unclassifiable; unclear; none |
3.2 |
|
3.8 |
|
| N = 317 | |
Quite a different distribution of reasons for not voting appears to be important for this group of people than we saw for the total set of non-voters in Table 12. A return glance at that table shows a virtual 3-way split between reasons of lack of interest, reasons of negativity towards the parties, candidates, issues, etc., and personal or administrative reasons for not voting. Of course, since we have isolated the interested non-voters in Table 24, we would expect that category of reason to drop off, as indeed it does. Only 16.1 percent mention reasons we have classified in this category at all, and more of these were in the "vote would be meaningless" subcategory than simple statements of lack of interest. Most interesting, however, is that the number of people citing reasons of negativity toward the institutions and personnel of the political system does not increase. Rather, the number of people giving a first reason for not voting in the personal/administrative category rises to over half of the total. This group of people was more likely to report being too busy, or away from home, or to have had registration problems, or not to know the details of where or when to vote. We will return to the issue of the impact of administrative factors on not voting later in this report, but we can note here that there may be potential for involving some of these interested non-voters in future elections.
Table 25 Current Interest Relative to 10 Years Earlier
| Percent | |
|---|---|
| A lot more interested in politics now than ten years ago |
17.5
|
| A little more interested in politics now than ten years ago |
18.4
|
| About the same level of interest |
37.5
|
| A little less interested now than ten years ago |
12.0
|
| A lot less interested now than you were ten years ago |
16.4
|
| N = 1 520 | |
We asked respondents born before 1974, who would have had a chance to participate in federal elections since 1993, to "Try to picture yourself ten years ago" and then tell the interviewers whether they felt their interest in politics had grown, lessened or remained the same since then. Table 25 shows that, overall, more people reported an increased interest in politics over the period. This development is to be expected, since we know that interest and participation are lowest in the youngest age groups (see previous section) and grow over time. However, there is a significant group (28.4 percent of those aged 28 or older) that reports decreased interest in politics; and more of these report they are "a lot less interested now than ... ten years ago" (16.4 percent) than just "a little less interested" (12 percent). When demographic variables are correlated with this "change in interest" variable, it appears that women, and those with higher income, are more likely to have increased their interest in politics over the past 10 years, as are those who have stayed in the same place of residence longer. None of these correlates is strong, however.
Table 26 Reasons for Greater Interest in Politics (Open-ended; multiple responses; percentage of respondents)
Personal Development |
Percent |
|---|---|
| Older |
35.9
|
| Politics has greater meaning now |
15.2
|
| Greater awareness; education |
14.3
|
| More time now |
8.2
|
| Concerned for future/younger generation |
5.8
|
| Saw opportunity to contribute; participate |
5.7
|
|
85.1
|
Increased Policy Concerns |
Percent |
|---|---|
| General increase in policy concerns; more policy impact |
7.9
|
| Social policy |
7.9
|
| Economic policy; economy |
6.4
|
| Foreign policy |
0.7
|
|
22.9
|
Political Developments |
Percent |
|---|---|
| Don't like developments; government |
9.7
|
| Support developments; changes; government |
2.5
|
| Other political |
1.8
|
|
14.0
|
Other; unclear |
Percent |
|---|---|
3.2 |
|
| N = 535 | |
Table 27Reasons for Lower Interest in Politics (Open-ended; multiple responses; percentage of respondents)
Political Attitudes |
Percent |
|---|---|
| Negative attitudes to politicians (false promises; dishonesty; selfishness; immaturity; non-professional; corruption) |
19.3
|
| Voting does not matter; has no effect; makes no difference |
17.7
|
| Lack of confidence/faith in conditions/parties/government |
14.5
|
| Political parties all the same; no choices |
9.4
|
| Lack of party competition; problems with parties |
9.3
|
| Don't relate to the issues/party programs |
8.0
|
| Public interest being neglected |
7.7
|
| Don't like leaders |
2.2
|
| Regional discontent |
2.1
|
|
90.2
|
Personal Reasons |
Percent |
|---|---|
| Too busy; other priorities |
12.5
|
| Apathetic; uninterested |
7.9
|
| Disillusioned; cynical |
4.9
|
|
25.3
|
Other; unclear |
Percent |
|---|---|
4.3 |
|
| N = 419 | |
A main reason for questioning the sample about their rising or declining political interest over the last 10 years was to ask those who reported a change an open-ended follow-up question about the reasons for this. The responses are presented in tables 26 and 27. The reasons for rise or decline in interest are dramatically different. For the group (Table 26) reporting an increase in political interest over the years, personal development is the main reason. People report that simply getting older has made them take an interest. Politics has taken on greater meaning with a new status as homeowner, taxpayer, new parent, or member of the workforce. Some people cited the effects of education. Others simply noted that they had more time to take an interest in politics. Other personal reasons given were a developed concern for the future, either for themselves or for the younger generation. Some saw greater opportunities than previously for making a contribution to society, or had participated in politics and found it stimulated interest. Other reasons given for increased interest in politics are related to a raised consciousness about policy matters in a variety of areas, or a sensitivity to political developments, primarily ones the respondent did not favour. These reasons for development of political interest are exactly what would be predicted with political socialization over the life cycle.
Consider the contrast of these personal reasons for developing political interest with the ones given by those who report a lessening of political interest in the last 10 years (Table 27). Here, most respondents give reasons related to political attitudes for this change. Leading the way are negative attitudes toward politicians, their false promises, dishonesty, selfishness, immaturity, unprofessional conduct, and corruption. A number of other categories in this table are in a similar vein, citing a lack of faith or confidence in the candidates, parties and government, or a distaste for the leaders. A second underlying theme of these answers has to do with the meaninglessness of voting. Respondents here mentioned that voting has no effect or makes no difference. It just does not matter; the political parties are all the same or they are not competitive. The issues or party programs do not connect with some of these non-voters. These reasons are indicative of a general malaise among a quarter of the population about those conducting modern Canadian politics. As with the previous group whose interest had increased, there is a minority category of those having personal reasons for a lessening interest. Here, the "too busy" response is paramount, with people citing other priorities in terms of work or family obligations.
Table 28 "What might happen in the next few years to make you more interested in politics?" (open-ended; multiple responses)
| Political System Changes | Percentage of respondents | Percentage of less interested | Percentage of 2000 non-voters |
|---|---|---|---|
| New candidates |
12.7
|
12.5
|
11.9
|
| New parties/platforms |
10.9
|
12.2
|
7.4
|
| New leaders |
7.2
|
7.9
|
5.3
|
| More competition/choice/stronger opposition |
6.8
|
6.7
|
3.3
|
| New government |
3.7
|
3.3
|
1.8
|
| Election/electoral system change |
3.2
|
3.3
|
3.1
|
|
44.5
|
45.9
|
32.8
|
| Politicians' Behaviour Changes | Percentage of respondents | Percentage of less interested | Percentage of 2000 non-voters |
|---|---|---|---|
| More honesty; responsibility; accountability |
10.6
|
12.0
|
11.3
|
| More contact with electorate |
6.4
|
7.9
|
7.5
|
| Change in attitude |
6.4
|
8.9
|
7.0
|
| More results; change in direction |
2.6
|
1.4
|
2.1
|
|
26.0
|
30.2
|
27.9
|
| Policy-related Changes | Percentage of respondents | Percentage of less interested | Percentage of 2000 non-voters |
|---|---|---|---|
| More attention to social policy |
11.1
|
10.6
|
10.9
|
| More attention to economic policy |
6.6
|
8.2
|
6.1
|
| New/better issues; other policies |
6.3
|
6.0
|
7.1
|
| More attention to foreign policy |
1.1
|
0.3
|
1.2
|
|
25.1
|
25.1
|
25.3
|
| Personal Changes | Percentage of respondents | Percentage of less interested | Percentage of 2000 non-voters |
|---|---|---|---|
| Gain more information |
7.1
|
2.7
|
10.0
|
| Age; time; personal development |
4.7
|
1.7
|
5.0
|
| More concern; interest |
2.2
|
1.1
|
2.6
|
|
14.0
|
5.5
|
17.6
|
| Other | Percentage of respondents | Percentage of less interested | Percentage of 2000 non-voters |
|---|---|---|---|
| A major national crisis |
1.3
|
0.5
|
1.5
|
| Other; unclassifiable |
3.0
|
2.7
|
3.5
|
|
4.3
|
3.2
|
5.0
|
| Nothing/don't know | Percentage of respondents | Percentage of less interested | Percentage of 2000 non-voters |
|---|---|---|---|
|
9.6
|
11.2
|
13.1
|
|
| N = |
1,869
|
449
|
899
|
What, if anything, might revive interest in politics? We followed by asking just that question: "What might happen in the next few years to make you more interested in politics?" of all the respondents. Table 28 presents a summary of the results, for the total sample of respondents and then two subgroups, those who had said they were now less interested in politics than they had been 10 years previously, and finally those who did not vote in 2000. We may first note, at the bottom of the table, that fewer than 10 percent (9.6 percent) of the total group said "nothing" could make them more interested, and in addition some of these people were already quite interested. We can conclude, at least from this evidence, that there are not a lot of Canadians who have become so alienated from the world of politics that they cannot see any way in which their interest can increase. And increased interest in politics would doubtlessly lead to a renewed interest in voting when future opportunities arise.
The changes that might improve political interest in future are summarized in Table 28 under the headings of Political System Changes; Politicians' Behaviour Changes; Policy-Related Changes; and Personal Changes. The most prominent are the first named – Political System Changes. An infusion of "new blood", in the form of new candidates for office, new leaders, and new or renewed political parties, and new party platforms would go a long way toward sparking new interest, says the public. A more competitive political situation would help as well, in the form of a stronger opposition or more evenly matched electoral races. Finally, a small number of Canadians advocated electoral reform, either in the sense of a new electoral system, or other changes to the voting laws. Overall, close to half of both the total, and the "less interested than ten years ago", cited some development in this political system change category which would boost their interest in politics, and one third of non-voters in 2000 did the same. Since current political events make it certain that there will be many new political leaders at the time of the next federal election, and likely that there will be a host of new candidates running at the local level, taking people at their word indicates that interest in a 2004/5 election should be greater than it was in 2000, which might result in a slight rebound in the voting rate.
The other possible changes cited by people in Table 28 are somewhat more problematic in their likely effect. Around over a quarter of the respondents called for politicians' behaviour to change, in the direction of greater honesty, responsibility, accountability, attentiveness, etc. These attitudes are no doubt more a product of general cynicism and negativism on the part of the public than a result of actual action or inaction on the part of elected officials, most of whom are doing their best to be accountable, attentive, honest, responsible, etc., already. Similarly, the proposed policy-related changes cited in the next category of responses would likely provoke the rejoinder from politicians that much of their activity already relates to policies in the areas cited by the public as needing "more attention." Greater concern for social policy leads the way in the list, but the "health policy" issue was already the most prominent issue in the 2000 election, when the interest and voter turnout were low. Still, there will be renewed attention to health policy issues in the next few years with the release of the Royal Commission report, and the new party leaders and candidates for leadership may espouse new ideas in this field, and energize public interest in policy. Finally, a number of people responded to the question in a different way, citing things that might change in their own lives to permit them to take a greater interest in politics. The most prominent of these was gaining more information or education about political subjects, but some people also felt that gaining time or years of age would bring greater opportunity for political involvement.
The general patterns of response in Table 28 are for the most part mirrored in the responses of the subgroups who had declined in interest over the last decade, or who did not vote in 2000. One difference of note, however, involves the non-voters of 2000, who were less likely to give responses in the political system change category than those who voted in that election. This difference is substantial. Since this group of non-voters is the one of immediate concern in this report, the result indicates that we must temper our conclusion above that the upcoming personnel changes in Canadian political leaders and candidates will increase public interest and future participation with the knowledge that this key group is less likely than average to be affected by these changes.