Explaining the Turnout Decline in Canadian Federal Elections: A New Survey of Non-voters
2. Reasons for Not Voting
Table 1 Reasons for the Turnout Decline (open-ended; multiple responses)
| Percentage of all respondents | Percentage of non-voters | |
|---|---|---|
| Politicians (negative public attitudes) |
26.2 |
24.9 |
| Government (negative public attitudes) |
13.0 |
16.0 |
| Candidates (negative public attitudes) |
11.7 |
12.4 |
| Political parties (negative public attitudes) |
6.3 |
6.2 |
| Issues (negative public attitudes) |
5.5 |
4.2 |
| Leaders (negative public attitudes) |
3.3 |
2.3 |
| Electoral system (negative public attitudes) |
1.0 |
0.5 |
| Election administration (problems) |
1.0 |
1.2 |
|
68.0 |
67.7 |
| Percentage of all respondents | Percentage of non-voters | |
|---|---|---|
| Meaninglessness of participation |
15.7 |
14.5 |
| Lack of competition |
14.0 |
8.6 |
| Regional discontent |
2.8 |
1.8 |
|
32.5 |
24.9 |
| Percentage of all respondents | Percentage of non-voters | |
|---|---|---|
| Apathy and lack of interest |
22.7 |
24.2 |
| Turned attention elsewhere |
5.1 |
5.8 |
| Lack of knowledge, information |
4.3 |
5.0 |
| Cynicism |
4.0 |
3.4 |
| Youth not voting |
3.1 |
1.9 |
|
39.2 |
40.3 |
| Percentage of all respondents | Percentage of non-voters | |
|---|---|---|
| Other |
3.1 |
5.0 |
| Do not know |
1.4 |
2.5 |
| N = |
4 659 |
848 |
In Table 1, and all other tables with multiple responses, category totals should be regarded as approximate, since respondents may give more than one response in the same category.
As an introduction, we may look at the reasons given by those in the current study to the open-ended question, "Voter turnout has been declining in recent Canadian federal elections. In your opinion, why is turnout going down?" This question was asked very early in the questionnaire, so that there were no specific questions the respondent could reference when thinking about this one. It was asked as part of the screening interview, before the respondents were asked whether they themselves had voted. It therefore has a large sample size, and gives a very broad, statistically accurate picture of the perceptions of Canadians on this subject. In Table 1 we present the general answers of all respondents, and also those given by a specific subset, those who did not vote in the 2000 federal election. Most of the answers from those who did not vote in 2000 are quite similar to the total, but a few differences will be mentioned.
The majority of Canadians attribute the turnout decline to negative public attitudes toward the performance of the politicians and political institutions involved in federal politics. The objects of perceived public displeasure run the complete gamut of personnel and institutions, but the most prominently mentioned were "politicians" and "the government", general terms which indicate the broad nature of the attitudes people ascribe to others. We must remember that these negative attitudes were not necessarily personally held by respondents who voted in the election. However, it is likely that the feelings reported here are fairly widespread.
The lodestones of discontent are politicians and the government. There is a widespread perception that politicians are untrustworthy, selfish, unaccountable, lack credibility, are not true to their word, etc. Similarly, the government, sometimes with a capital "G" and sometimes without, betrays the people's trust, and accomplishes little. Candidates are mentioned frequently, because the question asked specifically about the turnout decline, thereby raising the election context. As one might expect, they are perceived to have the same faults as "politicians". Political parties are singled out as well, because some attributed the lowered voting rate to the difficulties people might have in finding any good choices, or in distinguishing between the parties that do exist. And some said that potential voters have difficulty in relating to the issues brought forward by the parties at election time, or sometimes that the proposed policies are misguided.
With the answers just described relating to the deficiencies of political actors and institutions, it is difficult to discern what might have happened in recent years to precipitate a major decline in the voting rate. After all, citizens have complained about politicians and governments for a long time, and it is hard to believe that one could find any objective measure of "decline in quality" of candidates or elected officials, or of the actions of government.
To some degree, the malaise of discontent noted so far may be produced by a widespread feeling that political participation is meaningless. A number of these responses are captured specifically in the second section of Table 1, but such feelings may lie behind some of the other responses as well. Those classified under the "meaninglessness" heading commented on the lack of choice in elections, that voting would not change anything. "It's always the same thing over and over," said some. Others referred to the situation of "single party dominance", which made it seem that there was no realistic hope of an alternative government. It is reasonable to point out, however, that those who did not vote in 2000 were less likely to cite the lack of competition as a general diagnosis of the cause of falling turnout than the total group. And the ensuing analysis in this report finds that a perceived lack of competition is but one of several reasons for not casting a ballot.
The final major category in Table 1 identifies the responses that blamed public "apathy" for the decline in voting. According to many people, we are faced with a situation where people just do not care, do not pay attention, are lazy, or do not find the political scene exciting enough. A variation of this explanation is that people see non-voters as simply interested in other things, giving political participation a low priority. Or perhaps it is because those choosing not to vote have not bothered to get the information required to cast a meaningful vote. Some cited attitudes of cynicism, disillusionment, discouragement, frustration and hopelessness. Some specifically targeted young people as responsible for the voting decline, an observation which we will examine closely in this report, but one which does not provide reasons for this being so.
Overall, there seems a general recognition among the Canadian public that the voter turnout rate is declining and that there are identifiable explanations for the situation. Many of the problems identified defy easy solution, as they may well result from shifts in popular perceptions and expectations of the political system rather than any behavioural change among politicians and governments. Combined with a number of the analyses in this report, they suggest that the turnout decline we have been seeing in the 1990s may continue for some time to come.
The answers given by the general public to the question, "Why is turnout going down?", while they cluster around a number of major themes, are by no means centred on only one. Similarly, the open-ended question posed to non-voters, "What was the main reason you did not cast a ballot?", brought a variety of responses. Furthermore, some of the answers, related to decreased interest in elections, and in politics more generally, raise more questions than they answer. If declining turnout is a result of declining interest, why is interest going down? We may, therefore, expect to find a variety of explanations that combine to explain the low turnout in recent Canadian federal elections, rather than one single "key" to the situation. Another reason for this expectation is that Canadian elections have never seen the overwhelming voter turnouts experienced in some countries, particularly those in which voting is compulsory. The normal turnout since the Second World War has been about 75 percent of registered electors, and studies have often tried to delve into the reasons for non-participation of the remaining 25 percent. These previous surveys, for example as reported by Jon Pammett in "Voter turnout in Canada," in Herman Bakvis, ed., Voter Turnout in Canada (Volume 15 of the Research Studies for the Royal Commission on Electoral Reform and Party Financing), (Toronto: Dundurn, 1991, p. 39) showed a variety of reasons for not voting. In three election years when an open-ended question was asked of non-voters, about 40 percent said they were uninterested in the election, roughly one third said they were away from their polling places, under 20 percent said they were busy, about 10 percent were sick, and the remainder were unenumerated. We will meet all of these explanations in our questions later in this report. There is, therefore, no particular reason to expect that the rise in not voting that we have experienced in the 1990s will be attributable to any one key factor, though some factors may be more important than others.
Table 2 Factor Analysis of Reasons for Not Voting
| 1 | 2 | ||
|---|---|---|---|
a) |
I didn't know where or when to vote |
.65 |
.20 |
b) |
I was not on the list of electors |
.65 |
.00 |
c) |
I didn't think my vote would matter |
.00 |
.60 |
d) |
I didn't like any of the candidates or political parties |
.00 |
.59 |
e) |
I wasn't concerned with the issues of the campaign |
.21 |
.67 |
f) |
I was ill |
.70 |
.00 |
g) |
I was out of town |
.66 |
.00 |
h) |
I was too busy at work |
.52 |
.00 |
i) |
I just wasn't interested in the election |
-.18 |
.67 |
j) |
I think there are too many elections |
.33 |
.41 |
(principal components; varimax rotation) Factor 1: Personal/Administrative Factor 2: Lack of interest |
|||
The survey asks those who report not voting in 2000 the degree of importance 10 possible reasons had for them. Table 2 reports a factor analysis of this question. Factor analysis is a technique for data reduction, in that it explores the correlations among all the items in a group of variables, and identifies any common underlying commonalities, or factors, which lie behind them. Factor analysis is useful to the extent that the patterns of "factor loadings" (correlations of the individual variables with the underlying factors) have face validity, that is, are readily explicable. A further advantage of this technique is that the individual respondents are given scores ("factor scores") on each factor, which can be used later in a regression analysis as summary variables. Such an analysis will be reported later.
Table 2 shows that underlying the 10 separate potential reasons for not voting in the 2000 federal election, there are two summary factors. Factor 1 has high factor loadings (over .5) on five variables:
- a) I didn't vote because I didn't know where or when to vote.
- b) I didn't vote because I was not on the list of electors.
- c) I didn't vote because I was ill.
- d) I didn't vote because I was out of town.
- e) I didn't vote because I was busy at work.
The five variables listed here, which all load on Factor 1, appear to have sufficient coherence that we can name this a personal/administrative factor. The first two components of this factor, lack of information about the poll(ing) and not being on the list of electors, are clearly administrative in nature. The third, illness, and the fourth, absence from home, are connected in the sense that, had it been convenient for such people to cast their ballots under the circumstances of being confined by sickness or being away from the place they would normally be expected to vote, they might well have voted. Saying this is not to imply that Elections Canada is at fault for not collecting their votes; it simply means that under ideal administrative arrangements, they might have voted. Finally, the item "busy at work" as a reason for not voting loads on this factor, rather than the other one. This is interesting and worth exploring in more detail, since it was by no means self-evident that people who said they were busy were not just rationalizing what was really another kind of reason, lack of interest in the election. However, the fact that those who were "busy at work" load on Factor 1 makes it likely that they fall into the same category as the sick, the absent, and the unregistered – people who perceive that they were inhibited from casting a vote they might otherwise have cast.
Factor 2, displayed in Table 2, is of quite a different type than Factor 1. It includes the variables:
- c)I didn't vote because I didn't think my vote would matter.
- d)I didn't vote because I didn't like any of the candidates or political parties.
- e)I didn't vote because I wasn't concerned with the issues of the campaign.
- i)I didn't vote because I just wasn't interested in the election.
Factor 2 can be reasonably labelled a lack of interest factor. It groups together those who did not vote because they felt the election was uninteresting, their vote unimportant, and the parties, candidates and issues unengaging. Lack of interest, as measured by these questions, and others in the survey, was a major factor in explaining the low turnout in the 2000 general election. For example, over half (53 percent) of non-voters in 2000 said that the reason "I just wasn't interested in the election" was either "very" or "fairly" important in their decision not to cast a ballot.
Table 3 Importance of Reason: "I didn't
vote because I just wasn't interested in the election"
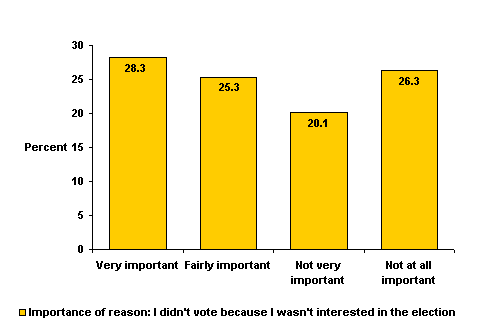
Table 4 Importance of Reason: "I didn't vote because
I didn't like any of the candidates or political parties"

Table 5 Importance of Reason: "I didn't vote because
I wasn't concerned with the issues of the campaign"
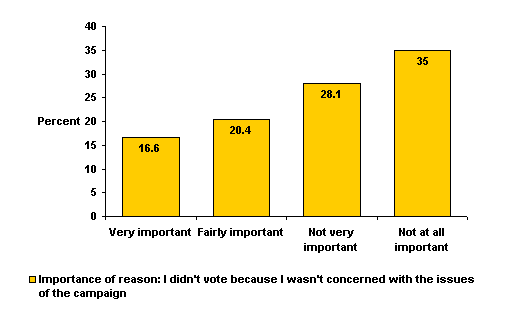
Table 6 Importance of Reason: "I didn't vote
because I didn't think my vote would matter"
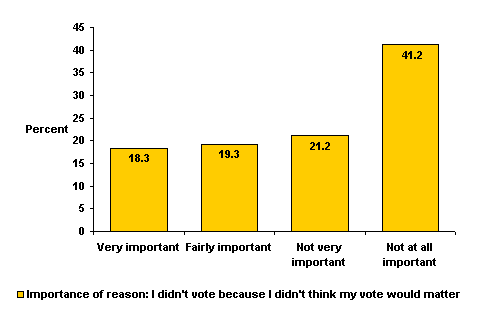
Let us examine first the variables measuring lack of interest in the election. By far the most frequently cited as important was "I just wasn't interested in the election" (Table 3). Over half of 2000 non-voters thought this was either "very important" or "fairly important" to their decision. While lack of interest may not connote a negative reaction to the set of alternatives on offer in the election, Tables 4 and 5 are more sharply focused in a negative direction. A substantial number of those not voting said they did not like any of the candidates or parties (47 percent) or were not concerned with the issues of the campaign (37 percent). As one might expect, lack of interest in the election correlates with not liking the parties or candidates (Taub = .15, p < .000) and with not being concerned with the issues of the campaign (Taub = .25, p < .000). A fourth reason, "I did not think my vote would matter" is cited by 37 percent as being important to some degree in their decision, and this factor is also intercorrelated with the other four.
Table 7 Importance of Reason: "I didn't know where or when to vote"

Table 8 Importance of Reason: "I was not on the list of electors"

Now let us consider the personal/administrative factors in not voting. Tables 7 and 8 show that about one fifth of those who did not vote said that lack of knowledge about the time and place to vote, or not being on the list of electors, was either "very" or "fairly" important to their decision. As one might expect, these two variables are fairly strongly correlated (Taub = .33, p < .000), which indicates that many of these are the same people. Since those who were not on the lists would not receive a voter information card telling them the hours and location of their polling place, they could reasonably cite both factors as being important to them. To estimate the impact on the total electorate, we need to put this in proportion. Perhaps the best measure of the direct impact of not being on the list of electors is the 12.7 percent of non-voters who said this was a "very important" factor to them. Since the overall voting rate was 61 percent, not being on the lists could be said to have depressed the voter turnout by about 5 percent (12.7 percent X .39 = 4.95 percent), if only these people who said it was "very important" are taken into account. If we add to them the people who said it was "fairly important," that number would rise.
However, this calculation is highly conjectural, since those saying that administrative factors were important to them often also mentioned "lack of interest" factors as important. For example, there is a positive correlation between respondents saying that it was important to the decision not to cast a vote that they were not on the list, and saying that it was important that they were not concerned with any of the issues of the campaign (Taub = .15, p < .000). So if these respondents had been on the lists, they might still not have voted, for other reasons. If one is willing to make the assumptions that 1) a door-to-door enumeration would have placed everybody on the list of electors, and 2) those for whom it was "very important" that they were not on the list would have voted if they had been there, regardless of the degree of their interest in the election, the deficiencies in the list of electors might have depressed the turnout by 5 percent. However, the most realistic conclusion is that the actual effect was less than that, perhaps somewhere around 2 or 3 percent.
Table 9 Importance of Reason: "I was ill"

Table 10 Importance of Reason: "I was out of town"
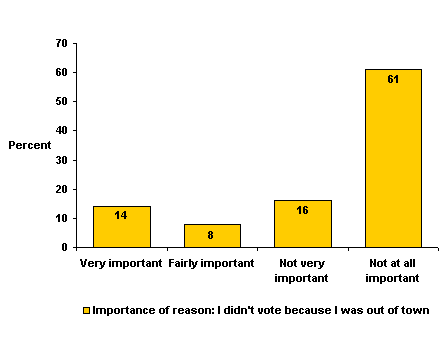
Table 11 Importance of Reason: "I was too busy at work"
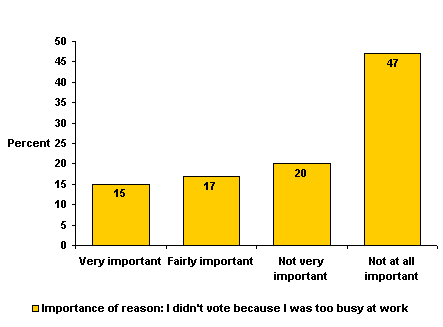
The next three tables show that other "personal/administrative" factors were associated with not voting to varying degrees. Provisions in the Canada Elections Act allow people who are ill, or who are out of town (tables 9 and 10) to register their choices at the advance polls and through the special ballot. However, these remedies often require advance planning, and the extra effort involved in implementing them is a deterrent to those who may not feel they have the energy, time and interest to provide motivation.
Finally, there are those who were "too busy at work", a group comprising almost one third of all non-voters, if one counts those for whom this factor was "very" or "fairly important". Of course, the Act provides that time off must be given to employees for voting purposes. But the demands of the workplace may have added obstacles for those who felt that other deterrents existed. We must remember that this variable loaded on the "personal/administrative factor" and not the "lack of interest" one. The correlations of being too busy at work with other personal/administrative factors are: with "not knowing where or when to vote" (Taub = .26, p < .000); with "not being on the list of electors" (Taub = .22, p < .000); with being ill (Taub = .19, p < .000); and with being "out of town" (Taub = .26, p < .000). These correlations are higher than those with "just wasn't interested in the election" (Taub = .01, not statistically significant); "didn't like any of the candidates or parties" (Taub = .06, p < .03); "I didn't think my vote would matter" (Taub = .09, p < .001); and "I wasn't interested in the issues" (Taub = .15, p < .000). So it is not as likely that people for whom this factor was important were just not interested enough to leave work to vote, as it is that some other factor was involved.
Table 12 Main Reasons for Not Voting, 2000 (Open-ended; multiple responses; percentage of respondents)
| Age Groups | |||||||
|---|---|---|---|---|---|---|---|
| 65+
|
55 – 64
|
45 – 54
|
35 – 44
|
25 – 34
|
18 – 24
|
Total
|
|
| Not interested; didn't care; apathy | 14.8 |
29.0 |
18.3 |
19.7 |
27.3 |
28.0 |
25.0 |
| Vote meaningless; doesn't count; election foregone conclusion |
6.4 |
8.4 |
9.6 |
10.0 |
11.4 |
6.5 |
9.0 |
| Forgot; unaware | 4.2 |
0.0 |
0.0 |
1.2 |
2.0 |
3.9 |
2.3 |
| Too complicated; confusing | 0.0 |
0.0 |
2.3 |
2.5 |
0.7 |
0.0 |
0.9 |
25.4 |
37.4 |
30.2 |
33.4 |
41.4 |
38.4 |
37.2 |
|
| Age Groups | |||||||
|---|---|---|---|---|---|---|---|
| 65+
|
55 – 64
|
45 – 54
|
35 – 44
|
25 – 34
|
18 – 24
|
Total
|
|
| No appealing candidates/parties/issues | 9.9 |
13.4 |
22.7 |
21.2 |
14.1 |
13.9 |
15.9 |
| Lack of faith/confidence in candidates/parties/leaders | 17.7 |
13.5 |
21.3 |
16.7 |
14.0 |
6.3 |
12.8 |
| Lack of information about candidates/parties/issues | 0.0 |
1.6 |
3.3 |
5.0 |
3.1 |
6.3 |
4.3 |
| Regional discontent | 0.0 |
3.0 |
3.0 |
2.8 |
0.5 |
0.8 |
1.4 |
27.6 |
31.5 |
50.3 |
45.7 |
31.7 |
27.3 |
34.4 |
|
| Age Groups | |||||||
|---|---|---|---|---|---|---|---|
| 65+
|
55 – 64
|
45 – 54
|
35 – 44
|
25 – 34
|
18 – 24
|
Total
|
|
| Too busy with work/school/family | 5.0 |
3.4 |
3.1 |
11.9 |
13.7 |
22.6 |
14.3 |
| Away from riding/province/country | 20.3 |
23.0 |
9.3 |
8.0 |
10.9 |
7.9 |
10.4 |
| Registration problems | 4.0 |
3.0 |
6.7 |
2.7 |
5.2 |
7.4 |
5.5 |
| Illness, health issues | 19.5 |
5.8 |
7.7 |
1.9 |
2.0 |
0.4 |
2.9 |
| Didn't know where or when; polling station problems; transportation | 5.7 |
5.1 |
2.7 |
2.5 |
2.2 |
4.2 |
3.3 |
| Moving-related problems | 0.0 |
0.0 |
2.5 |
1.1 |
1.2 |
0.5 |
0.9 |
54.5 |
40.3 |
32.0 |
28.1 |
35.2 |
43.0 |
37.3 |
|
| Age Groups | |||||||
|---|---|---|---|---|---|---|---|
| 65+
|
55 – 64
|
45 – 54
|
35 – 44
|
25 – 34
|
18 – 24
|
Total
|
|
| Religious reasons | 5.5 |
3.0 |
1.5 |
2.0 |
1.1 |
0.9 |
1.5 |
| Other; unclassifiable; unclear; none | 0.0 |
0.9 |
0.8 |
3.1 |
1.8 |
3.6 |
2.4 |
5.5 |
3.9 |
2.3 |
5.1 |
2.9 |
4.5 |
3.9 |
|
| N = | 43 |
58 |
109 |
171 |
331 |
347 |
1 059 |
Table 12 presents open-ended responses of non-voters to a question asking them about the main reason for their decision. The wide array of reasons, which can nevertheless be classified into three broad types (lack of interest, negativity, and personal/administrative), are mentioned to roughly equal degrees by non-voters. The largest single group of responses to this question was from those who simply weren't interested in the election (or politics more generally), didn't care it was being held, and did not want to vote. For others in this category, however, it was the meaninglessness of the voting that counted, as they reasoned that their vote would not matter or make a difference, and that the election was a foregone conclusion. A few others in the lack of interest category found the whole election scene too confusing for them, or just forgot about it.
We have classified responses as expressing negativity rather than simple lack of interest if they indicated a lack of confidence in any of the electoral contestants, candidates, parties or leaders, or said that they could find none of them appealing enough to vote for. Some of these respondents also said they did not find the discussion of issues involving, or they did not have enough information about the issues or other political factors to make a choice. A few of these respondents expressed grievances of one sort or another against the federal level of government, or stated they weren't interested in federal politics.
The third category, personal/administrative, has a variety of forms, as we have already seen. We have classified such reasons as "too busy" and "away" in this category, because in other measures in the survey, notably the factor analysis reported in Table 2, they are associated with other personal or administrative reasons rather than those measuring lack of interest. However, undoubtedly, some of those who said they were too busy to vote were simply rationalizing a lower interest level.
Table 12 shows a number of interesting variations in the reasons held by different age groups for not voting. In particular, the youngest age group, those aged 18 – 24 in 2000, was less likely to express reasons having to do with negative feelings towards political candidates, parties and leaders than were older age groups. They were, however, much more likely to cite personal or administrative reasons for not voting, particularly that they were too busy. They were also somewhat more likely to experience registration problems. The level of lack of interest was also above average in the youngest two age groups.
The oldest age group in the study, those over 65 years old, was most affected by health issues and by absence from their district at election time. And as far as negative feelings toward politicians, parties, etc., are concerned, the middle age groups, those between the mid-30s and the mid-50s, were more likely to cite these reasons.
