 Site Menu
Interest of Canadians in Internet Voting (2004, 2006, 2008 and 2011) – Research Note
Likelihood of Voting Over the Internet
Elections Canada introduced its first question relating solely to the likelihood of voting over the Internet in its post-election survey for the 2004 general election.Footnote 7 By categorizing the responses using an ordinal scale, it is possible to compare, with some reservation, the results for this question in 2004 with results obtained in 2008 and 2011.Footnote 8 As may be seen in Graph 1, the likelihood of electors voting over the Internet has tended to increase over time (from 48% in 2004 to 59% in 2011). We also note that the polarization of opinion seen in 2004 (with 38% indicating "Not at all likely" versus 37% indicating "Very likely") gradually lessened between 2004 and 2011, with a shift toward the middle ground ("Not very likely" / "Somewhat likely") and toward opinions indicating a very high likelihood of voting over the Internet.
Graph 1: Likelihood of Voting Over the Internet (2004, 2008 and 2011)

Text version of "Graph 1: Likelihood of Voting Over the Internet (2004, 2008 and 2011)"
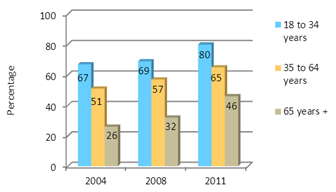
Interest in the likelihood of voting over the Internet is influenced by the different socio-demographic variables selected for this analysis. In regard to the age group variable, Graph 2 shows that the likelihood of voting over the Internet is higher in the 18-to-34 age group (between 67% and 80%) and the 35-to-64 age group (between 51% and 65%) when compared with the 65+ age group (between 26% and 46%).Footnote 9 That said, the rise in interest within each age group has been more pronounced in recent years (overall increase of 33 percentage points between 2008 and 2011, compared with 14 percentage points between 2004 and 2008). This rise has been more prominent in the 65+ age group, even though respondents from this group remain the least likely to be interested in voting over the Internet in 2004, 2008 and 2011.
The association between the age group variable and the likelihood of voting over the Internet is statistically significant in 2004, 2008 and 2011. Additionally, we note that this association is negative and of moderate strength from 2004 to 2011. In other words, all things being equal otherwise, the higher an individual's age group, the smaller the chance that this individual will have a positive opinion regarding the likelihood of voting over the Internet.
Graph 2: Age Group and Likelihood of Voting Over the Internet (2004, 2008 and 2011)
(% of respondents indicating that they would likely or very likely vote over the Internet if given the option)
| 2004 (EC) | 2008 (EC) | 2011 (CES) |
|---|---|---|
| Χ2 = 174.66 (p < 0.001) γ = –0.44 |
Χ2 = 131.26 (p < 0.001) γ = –0.39 |
Χ2 = 47.95 (p < 0.001) γ = –0.40 |
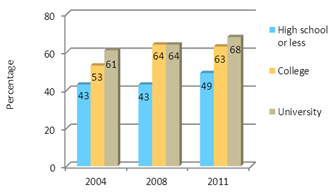
Regarding the education variable, we note that the likelihood of being interested in voting over the Internet tends to increase with the level of education. As shown in Graph 3, this favourable attitude towards voting over the Internet is substantially higher among university graduates (between 61% and 68%) and college graduates (between 53% and 64%) than among respondents with a high school diploma or less education (between 43% and 49%).
The association between education level and the likelihood of voting over the Internet is statistically significant in 2004, 2008 and 2011. Furthermore, we note that this positive association was relatively moderate in strength from 2004 to 2011. In other words, the higher an individual's level of education, the higher the chance that this individual will have a positive opinion concerning the likelihood of voting over the Internet.
Graph 3: Education and Likelihood of Voting Over the Internet (2004, 2008 and 2011)
(% of respondents indicating that they would likely or very likely vote over the Internet if given the option)
| 2004 (EC) | 2008 (EC) | 2011 (CES) |
|---|---|---|
| Χ2 = 63.40 (p < 0.001) γ = 0.25 |
Χ2 = 89.79 (p < 0.001) γ = 0.28 |
Χ2 = 27.93 (p < 0.001) γ = 0.26 |
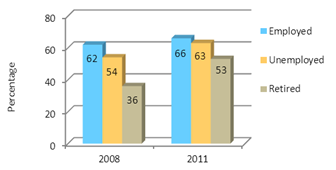
Finally, regarding the employment status variable,Footnote 10 Graph 4 shows that, in both 2008 and 2011, the likelihood of being interested in voting over the Internet is higher among those who were employed (between 62% and 66%) than among those who were unemployed (between 54% and 63%) or retired (between 36% and 53%). That said, the gap between the different employment statuses has decreased in 2011, due to a noticeable increase of interest towards Internet voting from retiredFootnote 11 and unemployed individuals.
Graph 4: Employment Status and Likelihood of Voting Over the Internet (2008 and 2011)
(% of respondents indicating that they would likely or very likely vote over the Internet if given the option)
| 2008 (EC) | 2011 (CES) |
|---|---|
| Χ2 = 96.88 (p < 0.001) Cramer's V = 0.21 |
Χ2 = 15.33 (p = 0.001) Cramer's V = 0.12 |
The association between employment status and the likelihood of voting over the Internet is statistically significant in both 2008 and 2011. However, we note a decrease in the strength of this association between 2008 and 2011.
Return to source of Footnote 7 This question used a scale of 1 to 5 (i.e.: 1 = Very likely; 3 = Neither likely nor unlikely; 5 = Not at all likely).
Return to source of Footnote 8 For the 2006 election, the question relating to the likelihood of voting over the Internet indicated "for future elections." In our view, this notion makes it impossible to compare the results for that question with those in the 2004, 2008 and 2011 surveys.
Return to source of Footnote 9 The response categories were recoded using a dichotomous nominal scale (Unlikely/Likely). The "Neither likely nor unlikely," "Don't know" and "Do not have access to Internet" categories were excluded from this analysis.
Return to source of Footnote 10 The "employment status" socio-demographic variable was not included in the 2004 Elections Canada survey.
Return to source of Footnote 11 On that note, percentages among retired individuals are somewhat similar to those among persons in the 65+ age group. This similarity stems primarily from the fact that most retirees are 65 years of age or older, and vice-versa.