 Site Menu
Analysis of Trends in Spending and Human Resources – 2020–21 Departmental Results Report
Actual Expenditures
Departmental Spending Trend Graph
The following graph presents planned (voted and statutory) spending over time.
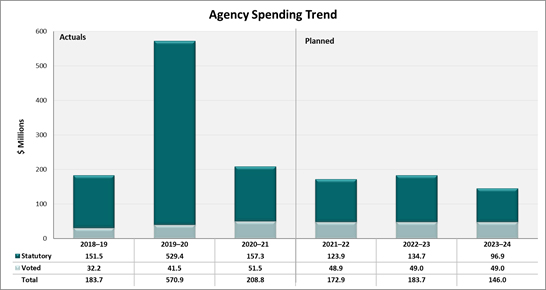
Text version of "Departmental Spending Trend"
This bar graph shows actual, forecast and planned spending for the fiscal years from 2018 to 2024 (in millions of dollars). For each year, spending is divided into two amounts: statutory and annual appropriation. (The latter amount is identified as voted in the image.) The total of both amounts is also provided.
Actual spending for the last three fiscal years was as follows:
- for 201819: statutory, 151.5 million dollars; voted, 32.2 million dollars; total, 183.7 million dollars
- for 201920: statutory, 529.4 million dollars; voted, 41.5 million dollars; total, 570.9 million dollars
- for 202021: statutory, 157.3 million dollars; voted, 51.5 million dollars; total, 208.8 million dollars
Planned spending for the next three fiscal years is as follows:
- for 202122: statutory, 123.9 million dollars; voted, 48.9 million dollars; total, 172.9 million dollars
- for 202223: statutory, 134.7 million dollars; voted, 49.0 million dollars; total, 183.7 million dollars
- for 202324: statutory, 96.9 million dollars; voted, 49.0 million dollars; total, 146.0 million dollars
*Totals may not add up due to rounding
Budgetary Performance Summary for Core Responsibilities and Internal Services (dollars)
The following table shows actual, forecast and planned spending for each of Election Canada's core responsibilities and to Internal Services for the years relevant to the current planning year.
| Core Responsibilities and Internal Services | 202021 Main Estimates |
202021 Planned spending1 |
202122 Planned spending1 |
202223 Planned spending1 |
202021 Total authorities available for use2 |
201819 Actual spending (authorities used) |
201920 Actual spending (authorities used) |
202021 Actual spending (authorities used) |
|---|---|---|---|---|---|---|---|---|
| Electoral Administration and Oversight | 82,078,356 | 82,078,356 | 112,848,442 | 120,161,578 | 144,920,112 | 120,907,167 | 515,137,124 | 143,558,420 |
| Electoral Compliance and Enforcement | 7,413,185 | 7,413,185 | 7,968,296 | 7,989,549 | 7,934,332 | N/A |
N/A |
7,770,484 |
| Subtotal | 89,491,541 | 89,491,541 | 120,816,738 | 128,151,127 | 152,854,444 | 120,907,167 | 515,137,124 | 151,328,904 |
| Internal Services | 44,188,889 | 44,188,889 | 52,049,466 | 55,596,442 | 58,228,280 | 62,841,306 | 55,759,213 | 57,501,257 |
| Total | 133,680,430 | 133,680,430 | 172,866,204 | 183,747,569 | 211,082,724 | 183,748,473 | 570,896,337 | 208,830,161 |
Note 1: Planned spending is the amount the Office of the Chief Electoral Officer planned to spend in a given fiscal year, as set out in the Main Estimates and in the Departmental Plan for that year.
Note 2: Total authorities available for use refer to the authorities available for spending in a given fiscal year, including those granted after Main Estimates and adjustments for statutory spending.
The agency's spending pattern generally reflects the election cycle: spending increases in the fiscal year before a general election, peaks in the fiscal year of an election, and decreases sharply in the fiscal year following an election.
The agency increased its election readiness operations in 2018–19, as it prepared for the 43rd general election. Expenditures peaked in 2019–20, as the general election took place in the fall of 2019. Spending decreased in 2020–21, but did not return to the usual level due to the fact that the 43rd general election resulted in a minority government. The agency initiated earlier than planned the full preparations for the 44th general election in a pandemic context. These factors were not known at the time planned spending was established. During a minority government, the agency does not include the general election delivery in its planned spending due to the unknown timing of the election. Additionally, the decennial electoral boundaries redistribution began in 2020–21 and will conclude in 2023–24. These variations affect only the statutory portion of the funding.
Lastly, further to the adoption of Bill C-76 in December 2018, Elections Canada and the Office of the Commissioner of Canada Elections were administratively reintegrated in April 2019, while continuing to operate independently of each other as per their mandates. This reintegration is reflected in an increase in expenditures and full-time equivalents starting in 201920.
Note: The annual proportion of Internal Services expenditures over the agency's total spending varies significantly. This is due to the election cycle. Over the last four fiscal years, this proportion fluctuated between 10% and 34% annually but had an average of 20%.
Actual Human Resources
| Core Responsibilities and Internal Services | 201819 Actual FTEs |
201920 Actual FTEs |
202021 Planned FTEs |
202021 Actual FTEs |
202122 Planned FTEs |
202223 Planned FTEs |
|---|---|---|---|---|---|---|
| Electoral Administration and Oversight | 502 | 756 | 502 | 651 | 790 | 808 |
| Electoral Compliance and Enforcement | N/A |
N/A |
48 | 43 | 44 | 44 |
| Subtotal | 502 | 756 | 550 | 694 | 834 | 852 |
| Internal Services | 216 | 239 | 244 | 262 | 281 | 286 |
| Total | 718 | 995 | 794 | 956 | 1,115 | 1,138 |
The fluctuation in full-time equivalents is a result of the election cycle and largely due to the reasons stated in the Budgetary Performance Summary, with the exception that there was significant one-time spending in 2020–21 for non-personnel election preparation activities. Personnel gradually hired in 2020–21 to achieve readiness in a minority government context and planned in 2021–22 and 2022–23 to maintain readiness explains the FTE increase in those two fiscal years.
Expenditures by Vote
For information on the Office of the Chief Electoral Officer's voted and statutory organizational expenditures, consult the Public Accounts of Canada 20202021.Footnote xxxiii
Government of Canada Spending and Activities
Information on the alignment of the Office of the Chief Electoral Officer's spending with the Government of Canada's spending and activities is available in GC InfoBase.Footnote xxxiv
Footnotes
Return to source of Footnote xxxiii Public Accounts of Canada, https://www.tpsgc-pwgsc.gc.ca/recgen/cpc-pac/index-eng.html
Return to source of Footnote xxxiv GC InfoBase, https://www.tbs-sct.gc.ca/ems-sgd/edb-bdd/index-eng.html#start