 Site Menu
Analysis of Financial Trends of Regulated Federal Political Entities, 20002014
4. Public FundingFootnote 15
a) Evolution of public funding
The introduction of quarterly allowances and the enhancement of election expenses reimbursements enacted in Bill C-24 were meant to counteract the loss of revenue resulting from the restrictions on contributions. While contributions decreased in 2004 and in subsequent years, the decrease was not as substantive as new public-sourced inflows. On average, per year, contribution funding decreased from $68.2 million before 2004 to $61.2 million during and after 2004, while on average, per year, public funding increased from $8.4 million before 2004 to $50.7 million during and after 2004. In fact, from 2004 to 2014, the new public funding sources partially explain the enhanced financial well-being at the end of 2014 of registered parties that were eligible for these public funding dollars.
The enactment of Bill C-24 created a change in the mix between contributions and public funding for regulated federal political entities before and after 2004. From 2000 to 2003, when comparing public versus contribution funding, contributions represented 89% of the total, while public funding was 11%. From 2004 to 2014, contributions fell to 55%, while public funding rose to 45%.
b) Quarterly allowances
Quarterly allowances added $289.9 million of cash inflows to eligible registered parties, or an average of $26.4 million a year, from 2004 to 2014. With the addition of quarterly allowances, annual average revenue streams to all regulated federal political entities went from $76.6 million before 2004 to $111.9 million after 2004, an increase of 46%.
From 2004 to 2014, the Conservative Party received 37% of all quarterly allowances; the Liberal Party received 28%, the NDP 20%, the Bloc Québécois 10% and the Green Party 5%.
However, with the passage of Bill C-13 in 2011, the full elimination of the quarterly allowance has reduced public funding to eligible registered parties. In 2016, the first full calendar year without the quarterly allowance, based on the 2015 general election results, the Liberal Party will experience a $16.6 million annual shortfall, the Conservative Party $13.4 million, the NDP $8.3 million, the Bloc Québécois $2.0 million and the Green Party $1.5 million.
c) Other sources of public funding
Before quarterly allowances were introduced in 2004, reimbursements of paid election expenses to registered parties and candidates represented 95% of all public funding from 2000 to 2003. Audit subsidies for candidates accounted for the remaining 5%.
From 2004 to 2014, reimbursements of paid expenses to registered parties and candidates represented 45% of all public funding, while quarterly allowances to registered parties accounted for 52%. Audit subsidies for candidates and EDAs represented 3%.
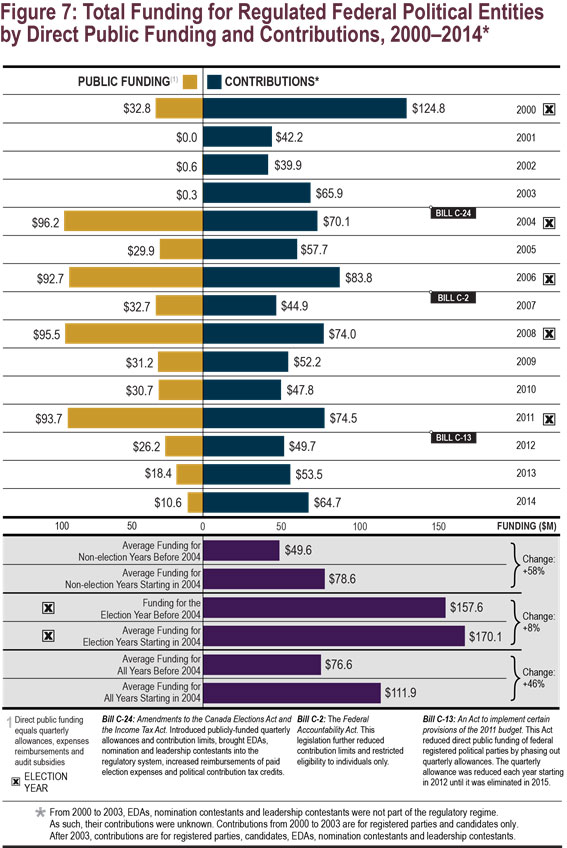

Figure 8: Quarterly Allowances by Each Eligible Registered Party, 2004–2015 – Text version
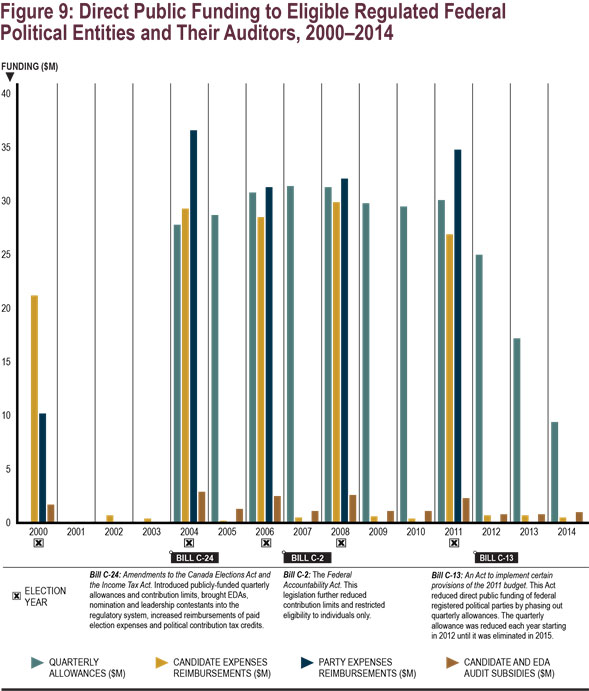
Return to source of Footnote 15 This section looks at direct public funding only (quarterly allowances paid to registered parties, the reimbursement of paid election-related expenses to registered parties and their candidates, and audit subsidies paid to the external auditors of candidates and registered EDAs). Indirect public funding (value of tax credits) is not considered.