 Site Menu
Survey of Electors – Whitby–Oshawa / Yellowhead By-elections
Section 3: Voting experience and identification requirements
This section provides information on the voting experience. It also highlights the convenience factor associated with the voting process when voting in person. Specifically, the satisfaction of voters with the language in which they were served and the waiting time at the respective voting location is discussed along with their perception about overall ease of voting process.
Note: The results in this section exclude those voters who voted through mail.
Satisfaction with voting experience
The overall impression is that the voters were very satisfied with the language of service and found the waiting time for voting to be reasonable. All voters in both ridings were served in English and it received an overwhelming satisfaction with 99% of voters indicating they were satisfied. The remaining 1% voters chose not to respond to this question.
- Comparing various sub-groups of voters revealed a consistent response to both these service aspects with no noticeable difference.
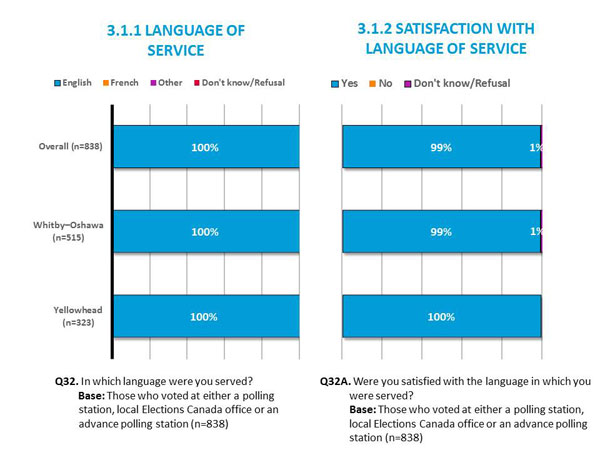
Text version of "3.1.1 Language of Service and 3.1.2 Satisfaction with Language of Service"
Almost all voters (99%) indicated that the waiting time for voting was reasonable. In Yellowhead, 100% of voters indicated the waiting time was reasonable with no exception.
- This positive response was found to be consistent among all demographic groups with little or no difference among sub-group categories.
Among those few who indicated otherwise, insufficient staff (22%) and long line-ups (19%) were two of the most commonly mentioned reasons (Caution: Very small base size (n=11)).
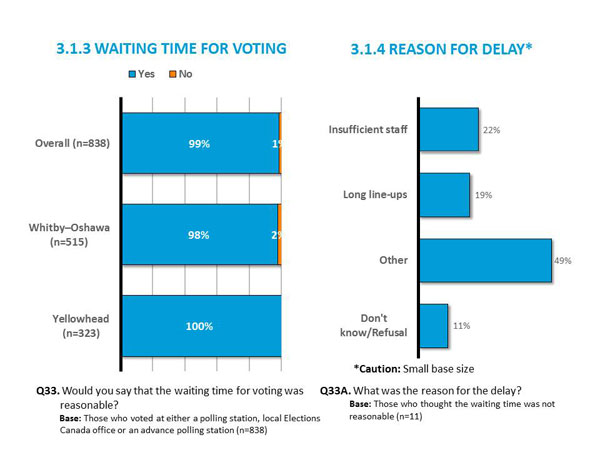
Text version of "3.1.3 Waiting Time for Voting and 3.1.4 Reason for Delay"
Overall, a wide majority (84%) of voters indicated it was very easy for them to cast their vote. The ease of voting was consistent among the two ridings with 84% of Whitby–Oshawa and 85% of the Yellowhead voters giving it the highest possible score.
- Among age categories, the middle aged voters found the voting process to be the easiest with significantly higher (89%) proportion of voters giving it the highest possible score against 76% young voters and 84% older voters. The lower score among younger age group could be because of the lack of familiarity and experience with the voting process. This also explains the lower proportion of students who found the voting process to be very easy.
- This pattern was even more prominent in Yellowhead with only 65% of students giving it the highest possible score as compared to 88% of middle aged and older voters.
- Once again, those voters who noticed the advertisement by Elections Canada found the voting process to be very easy (86%) as compared to those who did not (80%).
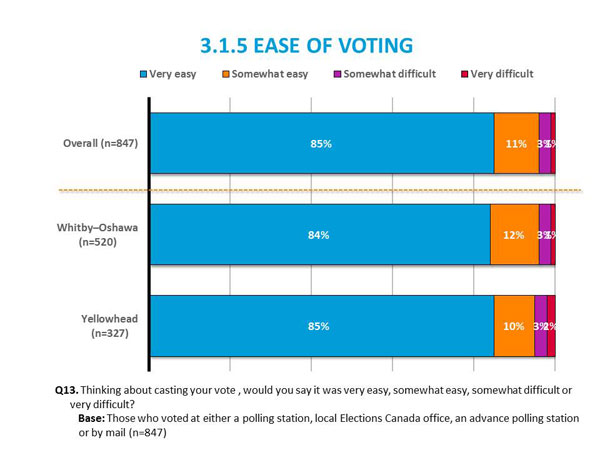
Text version of "3.1.5 Ease of Voting"
The ease of voting and satisfaction with specific service aspects seem to translate well into an overall satisfaction with the services provided by the Elections Canada staff. Overall, nine in ten (91%) voters indicated that they were very satisfied (highest possible score) with the services provided by the Elections Canada staff. Although voters in both ridings were satisfied with Elections Canada's services, Yellowhead scored slightly better on overall satisfaction with 93% voters indicating they were very satisfied as compared to 90% voters in Whitby–Oshawa. There were very minor differences among various sub-groups on satisfaction.
- Among employment categories, those who were unemployed or looking for a job were significantly more likely to give the highest possible score on overall satisfaction as compared to students (96% vs. 70%, respectively).
- Voters living in households with annual incomes of less than $40,000 were significantly more likely to be very satisfied with services provided by Elections Canada staff as compared to voters with household incomes of more than $100,000 (95% vs. 89%, respectively).
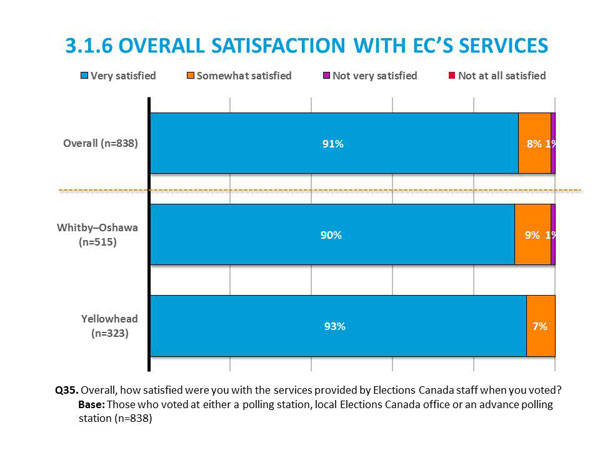
Text version of "3.1.6 Overall Satisfaction with Election Canada's Services"
3.2 Identification requirements
Very few (2%) voters said they did not have the required documents when they went to vote. Although both ridings were very similar in this respect, the proportion of voters who did not have the documents was slightly higher in Yellowhead (3% vs. 1%).
- All voters who were either a university graduate or completed community college indicated having the required documents when they went to vote.
- Almost all voters who had high school education or less in Yellowhead indicating having all the required documents whereas 6% did not have the documents in Whitby–Oshawa.
- All other sub-groups were fairly consistent in their response with no noticeable difference.
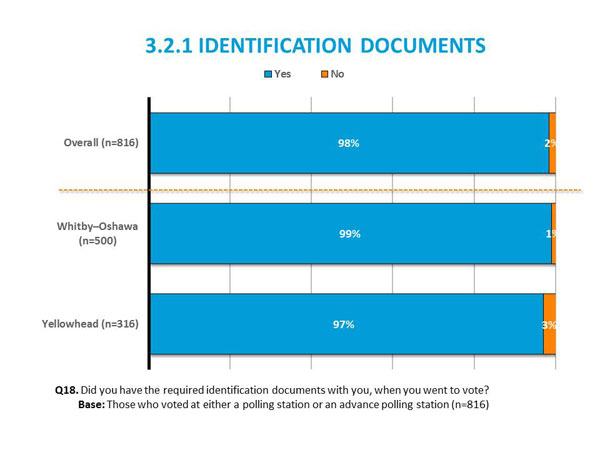
Text version of "3.2.1 Identification Documents"
An overwhelming majority of respondents used their driver's licence as proof of identity (93%) and address. A provincial/territorial ID card that could have also been used to prove both identity and address was used by 1% of the voters. Voters from both ridings were very similar in terms of the documents used when going to vote.
Although used by very few voters, other documents presented include Canadian passport (2%), utility bill (1%), or health card (1%). While the VIC was not an acceptable piece of ID, except in specific locations, 3% indicated having used it.
- Middle aged respondents (35-54) were the most likely to used their driver's licence (97% compared to 90% of youth and 91% of older respondents).
- Working voters were also significantly more likely to use driver's licence (96%) as compared to those unemployed (79%) or student voters (88%).
- Higher income respondents were also more likely to use their driver's licence. Nearly all (98%) respondents with an income of over $100,000 used it, compared to 91% of respondents making $60,000 to $100,000, 79% making $40,000 to $60,000 and 81% of respondents with an income of less than $40,000.
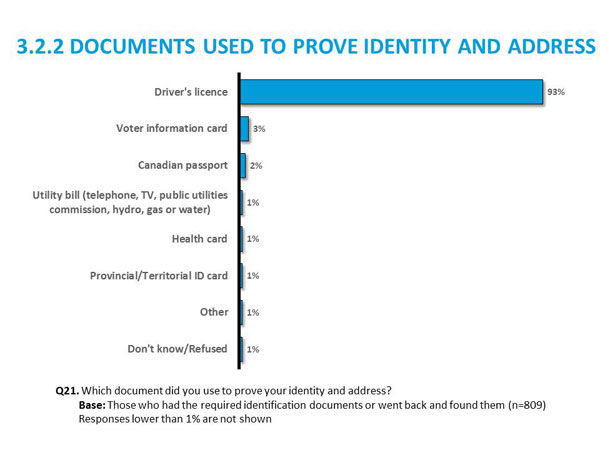
Text version of "3.2.2 Documents used to Prove Identity and Address"
Among the very few (n=12) who did not bring all the required documents with them for voting, nearly half (48%) were missing a document to prove their address while close to a quarter (24%) did not have a document that had their photo, name and address.
These respondents were further asked about what they did after realizing that they were missing some documents. Again, slightly less than half (46%) indicated that they went back to find missing documents. Only a few (8%) of these voters indicated swearing an oath before voting with incomplete documents.
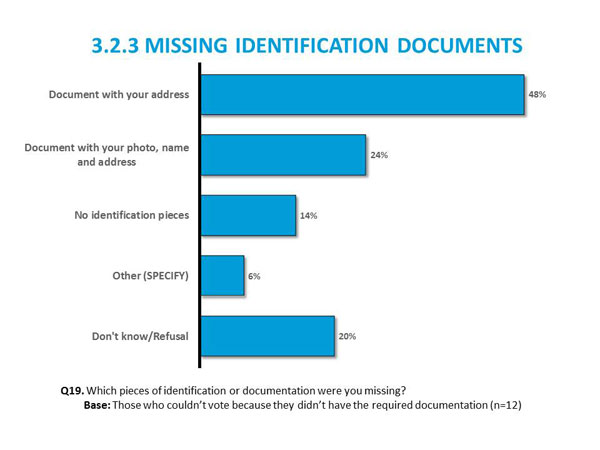
Text version of "3.2.3 Missing Identification Documents"
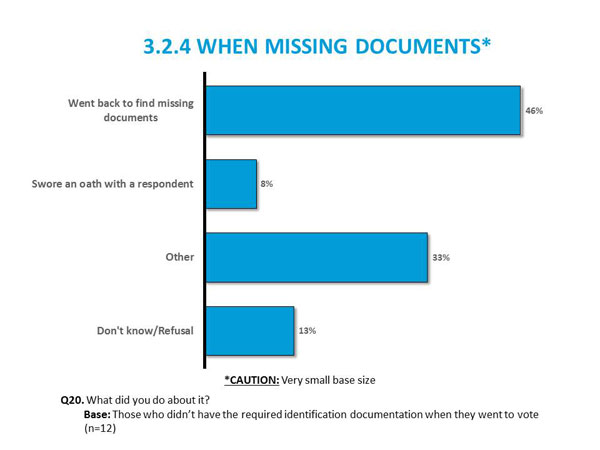
Text version of "3.2.4 When Missing Documents"
A majority of voters (83%) confirmed that it was very easy to meet the identification requirements while another 13% said it was somewhat easy.
- Respondents who noticed the advertisement from Elections Canada about the by-elections found it easier to meet the identification requirements as compared to those who did not notice the advertisement (86% vs. 78%, respectively).
- Respondents with higher incomes ($60,000 and over) thought it was easier to meet the identification requirements than respondents with lower incomes (less than $60,000).
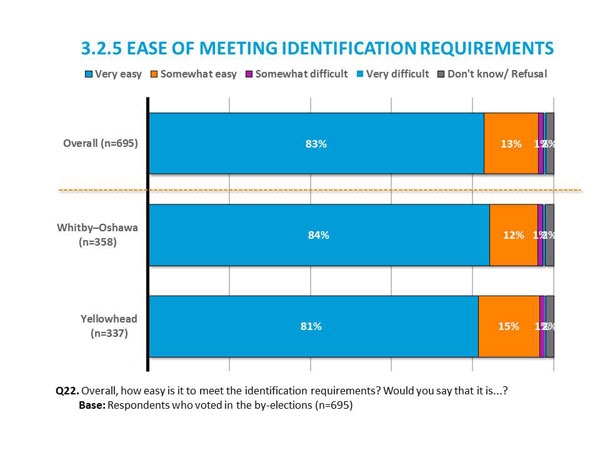
Text version of "3.2.5 Ease of Meeting Identification Requirements"
3.3 Perception of fairness
Overall, four out of five respondents thought Elections Canada ran the November 17 federal by-elections very or somewhat fairly, with nearly two thirds (63%) giving the highest possible score. Although the positive perception was true about voters from both ridings, voters from Whitby–Oshawa had a more positive view 70% said EC ran the elections very fairly compared to 56% in Yellowhead.
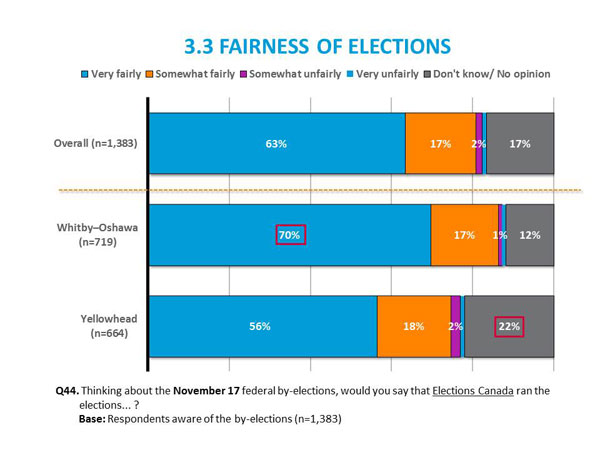
Text version of "3.3 Fairness of Election"
- About half of young respondents gave the highest possible score on fairness of the way by-elections were conducted. This was significantly lower than both other age groups (65% for middle aged and 69% for older voters).
- The proportion of voters who had a positive perception about fairness of by-elections appears to be decreasing with education.
- Overall, voter participation is significantly linked to the perception of fairness in the elections process.
- Those who voted in these by-elections were twice as likely to give the highest possible score on fairness.
- Respondents who indicated that they would/may have voted if an option was provided on Elections Canada website, were also more likely to give the highest possible score on fairness as compared to those who said they won't vote.
- Sub-groups in both ridings demonstrated similar behaviours with Whitby–Oshawa being more positive universally as compared to sub-groups in Yellowhead.