 Site Menu
Part 1: Quantitative Findings – National Electors Study following the 44th Canadian Federal Election: Report on the Voter Information Campaign and Elector Awareness
Part 1 presents survey results from the National Electors Study (NES), with a focus on the voter information campaign and electors' awareness of the electoral process during the 44th general election (GE).
1. Awareness of the Federal Election
The election period survey began on August 16, 2021. footnote 3 Through all phases of the election period survey, electors were asked whether they were aware that a federal election was scheduled to take place on September 20, 2021.
Virtually everyone was aware of the 44th federal election
Awareness of the September 20, 2021, federal election increased very modestly over the course of the election period, from 96% of respondents early in the election period survey to 99% in the early voting and election day phases. This is consistent with results from the 43rd GE in 2019, when 99% of electors surveyed in the final week of the election period were aware of the upcoming election.
Figure 1: Awareness of the federal election during the election period

Text version of "Figure 1: Awareness of the federal election during the election period"
The vertical bar chart presents respondents' awareness of the federal election that took place on September 20, 2021. Results are displayed across the various phases of the election period as follows:
- Total
- Early election phase: 96 percent
- Registration phase: 97 percent
- VIC (voter information card) phase: 98 percent
- Early voting phase: 99 percent
- Election day phase: 99 percent
Q. Are you aware that a federal election will take place on September 20, 2021? Base: all respondents (n=53,731) [WAVE 1]
Across the election period survey, those who voted in the 2019 federal election (99% versus 92% of non-voters who were eligible to vote)along with those interested in politics (99% versus 93% of those not interested in politics) and those who view voting as a duty (99% versus 96% of those who view voting as a choice)were more likely to have been aware of the upcoming federal election.
The following electors who completed the election period survey were less likely to report having been aware that a federal election will take place on September 20, 2021:
- electors with a disability (97% versus 99% of those without a disability)
- Indigenous electors (97% versus 98% of non-Indigenous electors)
- new Canadians (95% compared to 98% of other Canadians)
- 18- to 24-year-olds (95% versus 97% of 25- to 34-year-olds and 99% of electors aged 35 and older)
- 18- to 34-year-olds not in education, employment or training [NEET] (94% versus 95% of 18- to 34-year-olds working full-time and 95% of 18- to 34-year-olds attending school)
2. Unaided Recall of Elections Canada Advertising and Communications
This section of the report presents recall, on an unaided basis, of advertising and communications that formed Elections Canada's (EC) national voter information campaign for the 44th GE. The objective of the campaign was to provide electors with all the information they needed on when, where and ways to register and vote in the election.
The voter information campaign was a multimedia election period campaign conducted mainly in four phases with distinct focuses: 1) registration, 2) voter information card (VIC) awareness, 3) early voting options, and 4) election day. Phases in the election period survey largely corresponded with the election period phases of the voter information campaign. footnote 4
In addition to the four phases of the main advertising campaign, two additional ad campaigns ran during the entire election period: 1) a recruitment campaign that focused on employment opportunities during the general election, and 2) the safety campaign that focused on the safety measures in place to protect poll workers and voters during the COVID-19 pandemic.
Many had read, seen or heard EC advertising or communications during the election period
Beginning in the election period survey, respondents were asked if they had seen, heard or read any advertising or communications from Elections Canada about where, when and the ways to register and vote in the Canadian federal election.
Unaided recall increased throughout the election period survey, from 24% of respondents in the early election phase to 82% by the end of the election day phase. Post-election, ad recall continued to increase, reaching a high of 85% of surveyed electors. This is generally consistent with the pattern of increasing awareness recorded as part of the 2019 NES election period survey, from 21% of respondents early in the election up to 81% of respondents by the early voting phase and through to the end of the election day phase. footnote 5
Figure 2: Unaided recall of EC advertising

Text version of "Figure 2: Unaided recall of EC advertising"
This vertical bar chart shows respondents' unaided recall of Elections Canada advertisements and communications about the ways in which to vote in the federal election. Results are displayed across the various phases of the election period as follows:
- Total
- Early election phase: 24 percent
- Registration phase: 31 percent
- VIC phase: 54 percent
- Early voting phase: 75 percent
- Election day phase: 82 percent
- Post-election: 85 percent
Q. (Over the past few weeks or so, have you seen, heard or read/During the election campaign, did you see, hear or read) any advertising or communications from Elections Canada about where, when and the ways to register and vote in the Canadian federal election? Base: those aware of the election [WAVE 1, WAVE 2]
In the post-election survey, the likelihood of recalling EC advertising or communications about the federal election was higher among:
- those interested in politics (86% versus 77% of those not interested in politics)
- those who voted in the 2019 GE (86% versus 74% of non-voters who were eligible to vote in the 2019 GE)
- those who voted in the 2021 GE (86% versus 71% of non-voters)
- those who view voting as a duty (87% versus 79% of those who view voting as a choice)
The following groups of electors were less likely to have recalled advertising or communications:
- electors with a severe/very severe disability (81% versus 85% of those with a mild/moderate disability and 86% of those without a disability)
- Indigenous electors (82% versus 86% of non-Indigenous electors)
- 18- to 24-year-olds (81%) and 25- to 34-year-olds (80%) compared to electors aged 35 and older (87%)
- NEET youth (75% versus 82% of 18- to 34-year-olds working full-time and 82% of 18- to 34-year-olds attending school)
Electors mainly recalled seeing EC advertising or communications on television and via direct mail
Among election period respondents who recalled seeing EC advertising or communications, television was one of the top communication channels across all phases of the election period survey. It was followed by websites in general, radio, Facebook and newspaper. Notably, the proportion of surveyed electors who mentioned a postcard or brochure in the mail increased from 7% early in the election period to 49% by the early voting phase and 50% by election day, making it the top source of recall by the end of the election day phase. This coincides with the period when the voter information card (VIC) and Guide to the federal election were delivered to households.
The top channels among post-election respondents were television (56%), a postcard or brochure in the mail (48%) and radio (40%). These were followed by websites in general (29%), Facebook (27%) and newspaper (25%). Television and direct mail were also the main sources of unaided recall of EC advertising or communications about the voting process in 2015 (TV, 50%; direct mail, 30%) and 2019 (TV, 56%; direct mail, 38%).
In 2021, the increase in recall of ads on radio, websites and social media platforms observed in 2019 continued: radio (40% in 2021, 34% in 2019 and 15% in 2015), websites (29% in 2021, 20% in 2019 and 14% in 2015), and social media platforms, particularly Facebook (27% in 2021 versus 21% in 2019) and Instagram (10% in 2021 versus 5% in 2019).
The full range of responses can be found below in figure 3.
Figure 3: Channel of unaided ad recall
| Channels | Wave 1 (n=27,824) |
Wave 2 (n=26,338) |
||||
|---|---|---|---|---|---|---|
| Early election phase | Registration phase | VIC phase | Early voting phase | Election day phase | Post-election | |
| Television | 48% | 46% | 45% | 46% | 46% | 56% |
| Postcard or brochure in the mail | 7% | 11% | 27% | 49% | 50% | 48% |
| Radio | 33% | 33% | 34% | 33% | 35% | 40% |
| Website | 35% | 33% | 27% | 28% | 30% | 29% |
| 21% | 23% | 21% | 23% | 23% | 27% | |
| Newspaper | 21% | 21% | 19% | 21% | 22% | 25% |
| YouTube | 8% | 11% | 10% | 10% | 11% | 15% |
| Outdoor billboards | 9% | 12% | 11% | 13% | 14% | 15% |
| 8% | 10% | 8% | 7% | 10% | 10% | |
| Public transit (bus or subway) | 4% | 5% | 5% | 5% | 6% | 9% |
| 9% | 11% | 9% | 8% | 9% | 9% | |
| Snapchat | 1% | 2% | 1% | 1% | 2% | 3% |
| Spotify | 2% | 2% | 1% | 1% | 2% | 2% |
| Other | 3% | 2% | 3% | 2% | 3% | 1% |
| Don't know / don't remember | 4% | 4% | 3% | 2% | 3% | 2% |
Q. Where did you see or hear this advertising or communication? [Multiple responses accepted].
Base: those who recalled EC ads or communications [WAVE 1, WAVE 2]
Among post-election survey respondents, notable subgroup differences included the following:
- Indigenous electors were more likely to report having seen or heard Elections Canada advertising or communications on Facebook (35%) compared to non-Indigenous electors (26%).
- New Canadians were most likely to have seen Elections Canada communications or ads on websites (38% versus 31% of immigrants who became citizens before the 2015 GE and 29% of Canadians by birth), YouTube (27% versus 15% and 14%), and on Instagram (19% versus 8% and 10%).
- Youth aged 18 to 24 years and 25 to 34 years were more likely than older Canadians to have seen EC communications or ads on YouTube (43% and 30% versus 9%, respectively), Instagram (34% and 22% versus 5%) and Spotify (7% and 5% versus 1%). Youth aged 18 to 24 years were more likely to recall seeing ads on public transit (24% versus 12% of electors aged 25 to 34 years and 7% of those aged 35 and older) and on Snapchat (21% versus 5% and 0%, respectively).
- Seniors aged 65 years and older were more likely than younger electors to recall seeing EC ads or communications on television (71% versus 50%) and in the newspaper (41% versus 18%). Men were more likely than women to report seeing EC ads or communications on websites (31% versus 27%), but men were less likely than women and non-binary/transgender electors to recall seeing EC ads or communications on Facebook (23% versus 30% and 32%, respectively).
- Electors in Quebec were more likely than electors in any other province to recall seeing EC ads on television (65% versus a range of 49% to 58% across the other provinces), in newspapers (31% versus a range of 18% to 26%) and on outdoor billboards (21% versus a range of 11% to 16%).
One-third thought "get out and vote" was the main message of ads
Electors who recalled EC advertising or communications were asked, in an open-ended manner, what they thought was the main point of what they saw or heard. Through the election period and post-election surveys, the largest proportions of respondents said the main point of the ads was to remind electors to "get out and vote." This steadily increased from 17% in the early election phase, to 28% by the end of the election day phase, to 37% post-election.
Following "get out and vote," respondents indicated that the point of the ads was to provide general information on how, when and where to vote. Notably, higher proportions mentioned this during the latter phases of the voter information campaign (20% in the VIC phase, 24% in the early voting phase, and 24% in the election day phase) and post-election (25%).
Relatively few respondents identified more specific messages about how, when and where to vote in the election as the main message of the ads they saw or heard. Among post-election respondents, the specific messages electors most often mentioned were about there being many options/ways to vote (7% of those who recalled EC ads or communications), the need to be registered to vote (5%) and the fact that election day was on September 20 (4%).
Figure 4: Unaided recall of main ad message
| Messages | Wave 1 (n=4,078) |
Wave 2 (n=3,054) |
||||
|---|---|---|---|---|---|---|
| Early election phase | Regis-tration phase | VIC phase | Early voting phase | Election day phase | Post-election | |
| Get out and vote | 17% | 21% | 20% | 25% | 28% | 37% |
| General information on how, when, where to vote | 16% | 14% | 20% | 24% | 24% | 25% |
| It's important to vote | 5% | 6% | 7% | 7% | 7% | 8% |
| It is easy to vote | 1% | 3% | 2% | 3% | 3% | 7% |
| Many options / ways to vote | 7% | 5% | 5% | 5% | 4% | 7% |
| Need to be registered to vote | 4% | 5% | 5% | 2% | 2% | 5% |
| The federal election is on September 20 | 6% | 5% | 5% | 5% | 6% | 4% |
| You can vote safely | 10% | 7% | 6% | 6% | 5% | 3% |
| Check or update your registration | 1% | 3% | 2% | 1% | 1% | 3% |
| EC website has official information | 1% | 1% | 1% | 1% | 1% | 2% |
| It's our vote | 1% | <0.5% | <0.5% | 1% | 1% | 2% |
| It is a right to vote | 1% | 1% | 1% | 1% | 2% | 2% |
| Who is eligible to vote | <0.5% | 1% | <0.5% | -- | <0.5% | 2% |
| There are ways to vote early | 1% | 1% | 1% | 2% | 2% | 1% |
| There are safety measures at the polls | 3% | 2% | 3% | 2% | 3% | 1% |
| You need to prove identity and address to vote | -- | <0.5% | 1% | 1% | 1% | 1% |
| You can vote by mail | 9% | 6% | 3% | 2% | 2% | 1% |
| Check the mail for your VIC | 1% | 1% | 2% | 1% | <0.5% | 1% |
| VIC tells you when and where to vote | <0.5% | <0.5% | 1% | <0.5% | -- | 1% |
| You can work at the federal election | <0.5% | 1% | <0.5% | -- | <0.5% | <0.5% |
| Wear a mask when you go vote | 1% | <0.5% | <0.5% | <0.5% | <0.5% | -- |
| Other | 8% | 7% | 7% | 5% | 4% | 2% |
| Comments about political parties | 6% | 6% | 5% | 4% | 3% | 2% |
| Don't know/Don't remember | 27% | 27% | 26% | 27% | 26% | 18% |
Q. Thinking about the advertising and communications that you saw or heard, what do you think is the main point they were trying to get across? [Multiple responses accepted]. Base: those who recalled EC ads or communications unaided. [WAVE 1, WAVE 2]
3. Aided Recall of Key Elections Canada Communications
This section of the report presents aided recall of key Elections Canada (EC) communications, including the voter information campaign slogan and direct mail products sent to every registered elector and household in Canada: the voter information card (VIC) and the Guide to the federal election.
Aided recall of "It's Our Vote" slogan increased during the campaign leading up to election day
Electors were asked if they had heard or seen the slogan "It's Our Vote" during the election period survey. The proportion of respondents recalling the slogan increased over the course of the election period, from 15% during the early election phase to 24% in the week leading to election day. Recall of the slogan is virtually identical to the 2019 GE (18% recalled the slogan during the VIC phase, 21% during early voting and 24% by election day). The only difference of note is that recall of "It's Our Vote" was lower in 2019 during the early and registration phases of the campaign (12% and 14%, respectively).
Figure 5: Aided recall of "It's Our Vote" slogan

Text version of "Figure 5: Aided recall of "It's Our Vote" slogan"
This vertical bar chart shows respondents' recall of Elections Canada's "It's Our Vote" slogan. Results are displayed across the various phases of the election period as follows:
- Total
- Early election phase: 15 percent
- Registration phase: 16 percent
- VIC phase: 18 percent
- Early voting phase: 21 percent
- Election day phase: 24 percent
Q. Do you recall hearing or seeing the slogan "It's Our Vote"? Base: n=52,142; those aware of the election [WAVE 1]
Across the election period survey, the likelihood of recalling the "It's Our Vote" slogan was higher among the following groups:
- Indigenous electors (22% versus 19% of non-Indigenous electors)
- new Canadians (23% versus 20% of those who became citizens before the 2015 GE and 19% of Canadians by birth)
- 18- to 24-year-olds (29% versus 21% of 25- to 34-year-olds and 17% of older Canadians)
- those who recalled EC's ads and communications (25% versus 12% of those who did not)
- those who received a VIC (23% versus 18% of those who did not receive a VIC)
- Canadians interested in politics (19% versus 15% of electors not interested in politics)
- those who voted in 2019 (19% versus 16% of non-voters who were eligible to vote)
Vast majority recalled receiving a VIC; about half recalled receiving the brochure
A VIC was mailed to each registered elector beginning the week of August 30, 2021 (corresponding to the VIC phase of the election period survey). After sending the VICs, Elections Canada also mailed a brochure titled Guide to the federal election to every household in Canada.
The proportions of electors who recalled receiving a VIC climbed steadily through the election campaign, from 26% during the VIC phase of the election period survey, to 69% during the early voting phase, to 87% in the week leading to election day. Recall during the 2021 election period is noticeably lower than it was in 2019, when 80% reported receiving a VIC during the VIC phase of the election period, 90% by the early voting phase, and 92% by the election day phase. This slower recall rate corresponds to delays in the mailing of VICs that resulted from difficulties in finding suitable polling places during the COVID-19 pandemic. footnote 6
Post-election, over nine in 10 (92%) electors aware of the election recalled receiving a VIC addressed to them personally, similar to the 93% who reported receiving a VIC in the 2019 post-election survey.
Figure 6: Recall of VIC and brochure

Text version of "Figure 6: Recall of VIC and brochure"
This line chart compares respondents' recall of the receipt of their voter information card and Elections Canada's brochure. Results are displayed across the various phases of the election period as follows:
- Voter information card (VIC):
- VIC phase: 26 percent
- Early voting phase: 69 percent
- Election day phase: 87 percent
- Post-election: 92 percent
- Brochure:
- Early voting phase: 37 percent
- Election day phase: 46 percent
- Post-election: 56 percent
Q. So far in this election, have you received a voter information card in the mail addressed to you personally telling you where and when to vote?
Q. Do you remember receiving a brochure in the mail over the past few weeks or so describing how to prepare to vote in the upcoming federal election? Base: those aware of the election [WAVE 1, WAVE 2]
The same pattern is reflected in electors' recall of the brochure: 56% recalled receiving the brochure by the post-election survey, up from 37% who recalled the brochure during the VIC phase of the election period survey. Post-election recall of the brochure was higher than the 48% of electors who reported receiving the brochure following the 2019 general election.
Post-election, the following groups of electors were less likely to have recalled receiving a VIC:
- Indigenous electors (86% versus 92% of non-Indigenous electors)
- First Nations electors who live on reserve (72%) compared with First Nations electors who do not live on reserve (87%)
- electors with a severe/very severe disability (87% versus 91% of electors with a mild/moderate disability and 93% of those with no disability)
- new Canadians (89% versus 93% of those who became citizens before the 2015 GE and 92% of Canadians by birth)
- 18- to 24-year-olds (82% versus 90% of 25- to 34-year-olds and 94% of older Canadians)
- non-binary/transgender electors (83% compared with 93% of women and 92% of men)
- electors with a high school or less education (88% compared with 92% of those with some post-secondary/college and 93% who have completed university)
- electors who had moved in the last 12 months (81% versus 94% of those who had not moved)
Post-election, the following groups of electors were more likely to have recalled receiving a VIC:
- those who recalled EC's ads and communications (93% versus 86% of those who did not)
- Canadians interested in politics (92% versus 89% of electors not interested in politics)
- those who voted in 2021 (93% versus 77% of non-voters)
- those who voted in 2019 (93% versus 77% of non-voters who were eligible to vote)
Similar patterns of recall were evident when respondents were asked about the brochure. One notable difference, however, related to citizenship. New Canadians (66%) were more likely than those who became citizens before the 2015 election (59%) and Canadians by birth (55%) to remember receiving a brochure in the mail.
4. Aided Recall of Specific Elections Canada Advertising
This section of the report presents aided recall of specific EC advertising pieces selected as representative of the range of ad designs, formats and messages used in the voter information campaign.
Beginning with the registration phase of the election period survey, online respondents were divided at random into two ad campaign streams: the recruitment campaign stream and the active campaign stream based on the active survey phase in the main campaign according to survey date (registration, VIC, early voting options and election day). footnote 7 Respondents in each stream were presented with up to three ads from the selected campaign stream: a social media video ad (a social media video with music but no voiceover), an image ad (a print ad or animated web banner) or a broadcast ad (a radio ad or a TV ad with voiceover). Respondents were then asked whether they had seen or heard these specific ads during the election.
Aided recall of the campaign ads increased across the election period
Recall of the recruitment and main campaign ads increased over time: 13% of respondents presented with recruitment ads recalled at least one of the ads during the registration phase, when they were first presented in the survey. Recall of recruitment ads increased to 25% by the early voting phase before peaking at 31% by election day. Recall of the main campaign ads was higher and increased more significantly over the election period: 18% of respondents recalled at least one of the ads they were presented with during the registration phase, 39% during the VIC phase and 55% during the election day phase.
Figure 7: Aided recall of ads by phase

Text version of "Figure 7: Aided recall of ads by phase"
This vertical bar chart compares unaided recall of Elections Canada's recruitment campaign and main campaign ads. Results are displayed across the various phases of the election period as follows:
- Recruitment campaign recall
- Registration phase: 13 percent
- VIC phase: 16 percent
- Early voting phase: 25 percent
- Election day phase: 31 percent
- Main campaign recall
- Registration phase: 18 percent
- VIC phase: 39 percent
- Early voting phase: 47 percent
- Election day phase: 55 percent
Q. Have you seen this ad in the past few weeks? / Have you seen or heard this ad in the past few weeks?
Among those who were presented with recruitment campaign ads, the following subgroups were more likely to recall at least one of the ads over the course of the election period:
- youth aged 18 to 24 (26%) compared with those aged 25 to 34 (18%) and 35 and older (21%)
- seniors aged 65 and older (25%) compared with those aged 18 to 64 (19%)
- students aged 18 to 34 (22%) compared with those working full-time (14%) and NEET youth (13%)
- those who received a VIC (28%) compared with those who did not receive a VIC (17%)
Aided recall was highest for video and audio broadcast ads
With respect to the ad format, aided recall of radio and television broadcast ads was higher than recall of social media video ads or image ads throughout the election period. Among respondents who were presented with ads from the election day phase of the voter information campaign, 41% recalled specific broadcast ads, compared with 26% who recalled a social media video ad and 25% who recalled an image ad. The recruitment campaign and registration phase lacked broadcast ads, which may in part explain the lower overall level of aided recall for those campaigns.
Figure 8: Aided recall of specific ads by format and ad campaign

Text version of "Figure 8: Aided recall of specific ads by format and ad campaign"
This vertical bar chart compares aided recall of specific Elections Canada ads displayed by format and ad campaign. Results are displayed across the various phases of the election period as follows:
- Social media ad:
- Recruitment: 14 percent
- Registration: 10 percent
- VIC: 16 percent
- Early voting: 20 percent
- Election day: 26 percent
- Image ad:
- Recruitment: 16 percent
- Registration: 12 percent
- VIC: 13 percent
- Early voting: 21 percent
- Election day: 25 percent
- Broadcast ad:
- Recruitment: --
- Registration:--
- VIC: 31 percent
- Early voting: 36 percent
- Election day: 41 percent
Q. Have you seen or heard this ad in the past few weeks? / Have you seen this ad in the past few weeks?
5. Evaluation of Ads
This section of the report presents respondents' evaluation of Elections Canada's advertising based on the ads presented to respondents during the survey.
Perceptions of the main ad message is varied; many say ads intend to encourage voting
All respondents were asked to select from a list what they thought was the main point electors were intended to get from the ads they were shown. The list included a mix of specific messages taken from the ads alongside more general messages that represent commonly volunteered responses from previous surveys of electors.
Across all ad campaigns, the largest proportions of respondents indicated that a main point of the ads they were presented with was the September 20 date of the federal election (results range from 49% to 57%). This was followed by mentions of the general messages "get out and vote" (40% to 48%) and "it's important to vote" (36% to 42%).
Compared to unaided recall, respondents more often identified specific ad messages when aided by the presentation of specific ads. In particular, general COVID-19 health and safety messages found in ads across all campaigns and phases were identified more often across all respondents, including "you can vote safely" (25% to 37%) and "there are safety measures at the polls" (20% to 28%).
Figure 9: Perceptions of main ad message
| Messages | Ad Campaign Wave 1 (n=43,951) |
||||
|---|---|---|---|---|---|
| Recruitment | Registration | VIC | Early voting options | Election day | |
| The federal election is on September 20, 2021 | 49% | 52% | 57% | 56% | 56% |
| Get out and vote | 40% | 44% | 40% | 46% | 48% |
| It's important to vote | 36% | 41% | 38% | 42% | 42% |
| VIC tells you when and where to vote | 22% | 21% | 47% | 33% | 39% |
| It is easy to vote | 30% | 33% | 32% | 47% | 39% |
| You can vote safely | 27% | 32% | 25% | 37% | 33% |
| There are ways to vote early | 22% | 21% | 22% | 52% | 30% |
| Check the mail for your voter information card | 20% | 19% | 43% | 28% | 29% |
| There are safety measures at the polls | 24% | 28% | 20% | 28% | 27% |
| Need to prove identity and address to vote | 14% | 16% | 14% | 16% | 27% |
| The EC website has official information | 23% | 27% | 27% | 27% | 27% |
| You need to be registered to vote | 24% | 35% | 37% | 21% | 24% |
| It's our vote | 22% | 22% | 21% | 25% | 23% |
| Check or update your registration | 22% | 34% | 28% | 17% | 18% |
| Who is eligible to vote | 14% | 16% | 11% | 13% | 13% |
| Apply on the Elections Canada website | 16% | 8% | 7% | 6% | 6% |
| You can work at the federal election | 29% | 7% | 5% | 6% | 5% |
| Paid positions are available | 25% | 5% | 4% | 4% | 4% |
| Other | 1% | 1% | 1% | 1% | 1% |
| Don't know / don't remember | 8% | 8% | 7% | 8% | 7% |
Q. What do you think is the main point these ads are trying to get across?
Messages associated with specific campaigns or phases of the voter information campaign were identified more often as the main point of ads presented to those streams:
- Mentions of recruitment messages were higher among respondents presented with recruitment ads: "you can work at the federal election" (29%), "paid positions are available" (25%) and "apply on the Elections Canada website" (16%).
- Mentions of registration messages were higher among respondents presented with registration ads: "you need to be registered to vote" (35%) and "check or update your registration" (34%).
- Mentions of messages about the VIC were higher among respondents presented with VIC ads: "the VIC tells you when and where to vote" (47%) and "check the mail for your VIC" (43%).
- Mentions of messages about the early voting options were higher among respondents presented with early voting options ads: "there are ways to vote early" (52%). Mentions of "it is easy to vote" were also highest in this stream (47%), possibly because electors perceive that having multiple ways to vote early makes voting easier.
Ads received generally positive reviews
Election period respondents were asked to evaluate the ads they were presented with in the survey against four measures. The ads received positive assessments in all areas, and assessments were very similar to those recorded in 2019 following the 43rd GE.
The vast majority of respondents (85% each) somewhat or strongly agreed that the ads were clear and provided useful information. Few disagreed that the ads were clear (7%) and provided useful information (8%). Smaller majorities agreed that the ads were relevant (71%) and attention catching (63%). For both of these measures, respondents were more likely to agree somewhat rather than strongly. Conversely, disagreement was higher for these measures: 22% disagreed that the ads were relevant and 28% disagreed that they were attention catching.
Figure 10: Ad evaluation overall

Text version of "Figure 10: Ad evaluation overall"
This stacked horizontal bar chart compares level of agreement to various statements pertaining to Elections Canada's ads. The breakdown is as follows:
- Statement Ads are clear:
- Strongly agree: 41 percent
- Somewhat agree: 45 percent
- Somewhat disagree: 5 percent
- Strongly disagree: 2 percent
- Statement Ads provide useful information:
- Strongly agree: 41 percent
- Somewhat agree: 44 percent
- Somewhat disagree: 6 percent
- Strongly disagree: 3 percent
- Statement Ads are relevant:
- Strongly agree: 23 percent
- Somewhat agree: 48 percent
- Somewhat disagree: 15 percent
- Strongly disagree: 7 percent
- Statement Ads catch my attention:
- Strongly agree: 12 percent
- Somewhat agree: 51 percent
- Somewhat disagree: 20 percent
- Strongly disagree: 8 percent
Q. To what extent do you agree or disagree with the following statements about these ads? Base: n=43,951; all respondents. DK/NR: 7 percent-9 percent. [WAVE 1]
Assessments of the ads for each separate campaign and phase were also positive overall, although electors were generally more positive in their assessments of ads related to the VIC, early voting options and election day compared with ads related to recruitment and registration. For example, a range of 73% to 76% of electors presented with VIC, early voting and election day ads agreed that the ads were relevant to them, compared with 70% of electors presented with registration ads and 66% of electors presented with recruitment ads.
The following subgroup differences are noteworthy:
- Electors with a severe/very severe disability were less likely than electors with a mild/moderate disability or no disability to somewhat or strongly agree that the ads presented were clear (80% versus 84% and 86%, respectively), that they provided useful information (79% versus 84% and 86%), that they were relevant to them (67% versus 72% and 72%) and that they were attention catching (55% versus 62% and 65%).
- Indigenous electors were less likely than non-Indigenous electors to somewhat or strongly agree that the ads presented were clear (83% versus 86%), that they provided useful information (81% versus 85%), that they were relevant to them (68% versus 72%) and that they were attention catching (60% versus 64%).
- New Canadians were more likely to agree that the ads were clear (89% versus 86% of those who became citizens before the 2015 GE and 85% of Canadians by birth). New Canadians and immigrants who became citizens before the 2015 election were more likely than Canadians by birth to agree that the ads provided useful information (88% and 86% versus 85%, respectively), were relevant to them (82% and 76% versus 70%) and caught their attention (74% and 70% versus 62%).
- Youth aged 18 to 24 years of age were more likely than other age groups to offer positive assessments of the ads across three of the four measures: the ads were relevant to them (77% of youth aged 18 to 24 versus 70% of those aged 25 to 34 and 71% of those aged 35 and older), the ads were clear (88% versus 85% and 85%) and the ads provided useful information (87% versus 83% and 85%).
- Canadians aged 35 and older, in particular those aged 65+, were more likely than younger Canadians to agree that the ads were attention catching (65% of those aged 35 and older and 71% of electors 65 years of age and older compared with 60% of 18- to-24-year-olds and 55% of 25- to-34-year-olds).
- In addition, 18- to 34-year-olds attending school were more likely than youth working full-time and NEET youth to say that the ads caught their attention (62% versus 53% and 53%, respectively), that the ads were relevant to them (78% versus 70% and 70%), that the ads were clear (89% versus 85% and 83%) and that the ads provided useful information (88% versus 83% and 83%).
6. Satisfaction with Electoral Information
This section reports how satisfied respondents were with the electoral information provided by Elections Canada for the 44th GE and how informed they felt they were about where, when and the ways to vote over the course of the voter information campaign.
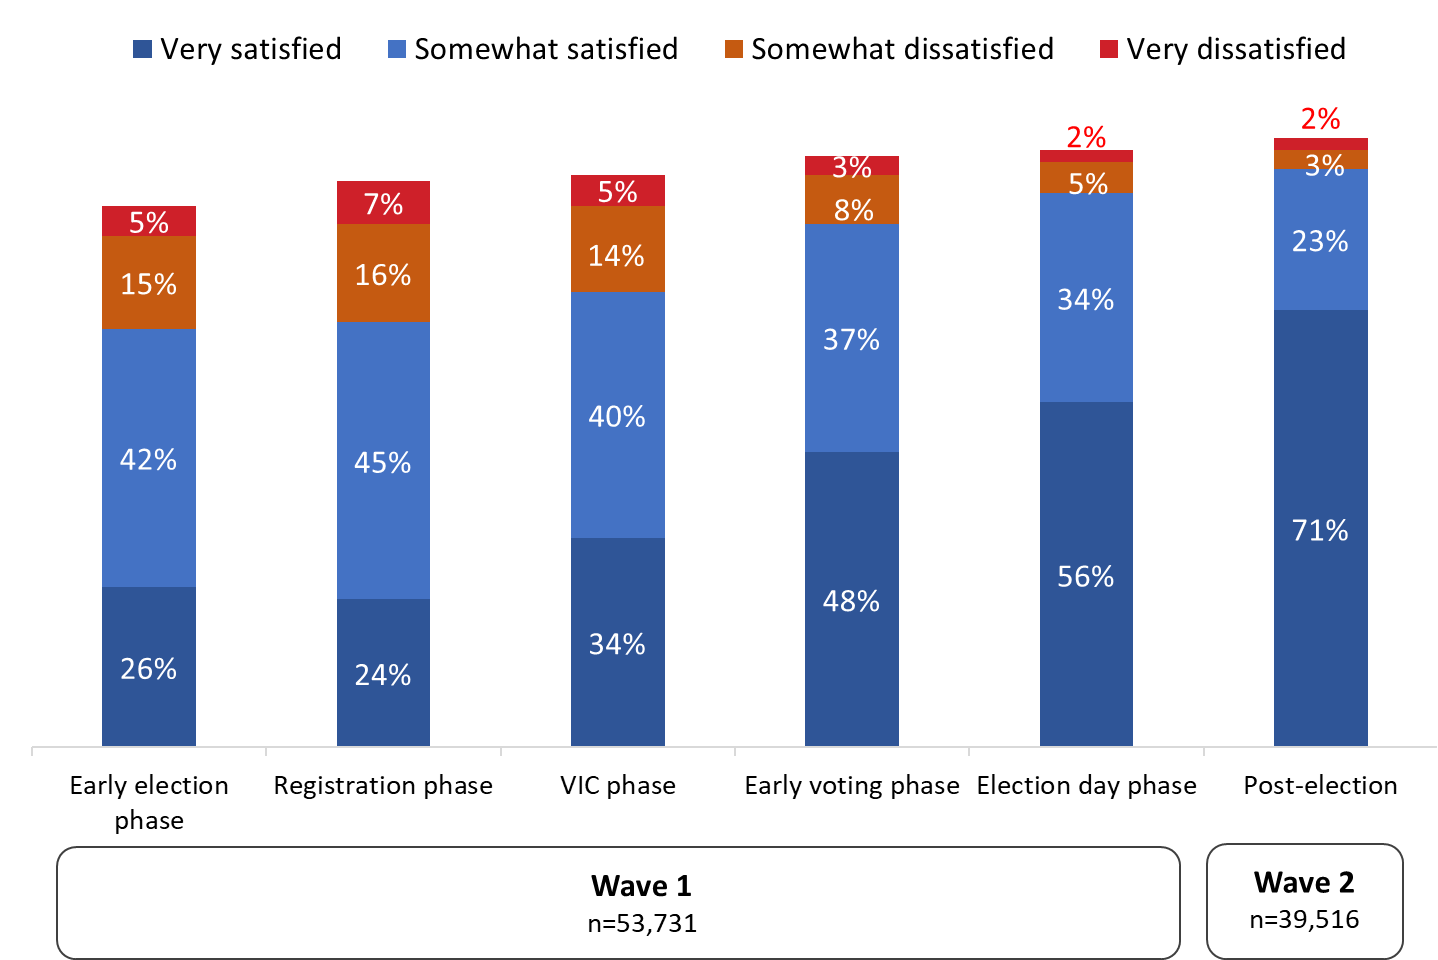
Electors' satisfaction with EC information on voting increased over the campaign
Satisfaction with the information electors received from Elections Canada on the voting process increased over the course of the voter information campaign, from 69% who were satisfied (26% very satisfied) during the early election phase up to 94% who were satisfied (71% very satisfied) with the information received by the post-election survey. This outcome is consistent with the results of the 2019 NES, where 95% of post-election survey respondents were satisfied with the information they received from Elections Canada on the voting process.
Figure 11: Satisfaction with information on the voting process
Text version of "Figure 11: Satisfaction with information on the voting process"
This stacked vertical bar chart compares the level of satisfaction with the information received on the voting process. Results are displayed across the various phases of the election period as follows:
- Early election phase:
- Very satisfied: 26 percent
- Somewhat satisfied: 42 percent
- Somewhat dissatisfied: 15 percent
- Very dissatisfied: 5 percent
- Registration phase:
- Very satisfied: 24 percent
- Somewhat satisfied: 45 percent
- Somewhat dissatisfied: 16 percent
- Very dissatisfied: 7 percent
- VIC phase:
- Very satisfied: 34 percent
- Somewhat satisfied: 40 percent
- Somewhat dissatisfied: 14 percent
- Very dissatisfied: 5 percent
- Early voting phase:
- Very satisfied: 48 percent
- Somewhat satisfied: 37 percent
- Somewhat dissatisfied: 8 percent
- Very dissatisfied: 3 percent
- Election day phase:
- Very satisfied: 56 percent
- Somewhat satisfied: 34 percent
- Somewhat dissatisfied: 5 percent
- Very dissatisfied: 2 percent
- Post-election:
- Very satisfied: 71 percent
- Somewhat satisfied: 23 percent
- Somewhat dissatisfied: 3 percent
- Very dissatisfied: 2 percent
Q. Overall, how satisfied are you with the information you have received from Elections Canada on the voting process, meaning where, when and the ways to vote in the federal election? Base: those aware of the election [WAVE 1, WAVE 2]
Among electors who completed the post-election survey, the likelihood of being satisfied with the information received was lower among:
- electors with a disability (92% versus 95% of those without a disability), specifically those with a severe or very severe disability (87%)
- Indigenous electors (89% versus 94% of non-Indigenous electors). Among First Nations electors, those living on a reserve were less likely to be satisfied than those who do not live on a reserve (82% versus 91%)
- 18- to 24-year-olds (89% versus 92% of 25- to 34-year-olds and 95% of electors aged 35 and older)
The likelihood of being satisfied with the information received was higher among:
- those who received a VIC (96% versus 75% of those who did not)
- those who recalled seeing EC advertising (96% versus 80% of those who did not)
- voters (95% versus 76% of non-voters)
- those who voted in 2019 (95% versus 80% of non-voters who were eligible to vote)
- those interested in politics (95% versus 88% of those not interested in politics)
Most felt informed about when, where and how to vote
Over the course of the election period, most electors reported that they felt at least somewhat informed about when, where and how to vote in the 44th GE. Early in the election period, nine in 10 electors (91%) said they felt at least somewhat informed, including more than half (56%) who felt very informed. In the post-election survey, 96% of electors who completed the post-election survey reported feeling informed, including 74% who said they felt very informed, which is consistent with the results of the 2019 NES.
Figure 12: How informed electors felt about when, where and how to vote

Text version of "Figure 12: How informed electors felt about when, where and how to vote"
This stacked vertical bar chart compares the level to which electors felt informed about when, where and how to vote. Results are displayed across the various phases of the election period as follows:
- Early election phase:
- Very informed: 56 percent
- Somewhat informed: 35 percent
- Not very informed: 7 percent
- Not at all informed: 2 percent
- Registration phase:
- Very informed: 52 percent
- Somewhat informed: 36 percent
- Not very informed: 8 percent
- Not at all informed: 2 percent
- VIC phase:
- Very informed: 55 percent
- Somewhat informed: 35 percent
- Not very informed: 8 percent
- Not at all informed: 2 percent
- Early voting phase:
- Very informed: 62 percent
- Somewhat informed: 31 percent
- Not very informed: 5 percent
- Not at all informed: 1 percent
- Election day phase:
- Very informed: 66 percent
- Somewhat informed: 28 percent
- Not very informed: 5 percent
- Not at all informed: 1 percent
- Post-election:
- Very informed: 74 percent
- Somewhat informed: 22 percent
- Not very informed: 3 percent
- Not at all informed: 1 percent
Q. Overall, how well informed do you feel you are about when, where and how to vote in the federal election? Base: Those aware of the election [DK/NR: <0.5%]. [WAVE 1, WAVE 2]
Post-election, the likelihood of respondents saying they felt very informed about when, where and how to vote was lower among the following subgroups:
- electors with a disability (68% versus 78% of those without a disability), specifically those with a severe (62%) or very severe (59%) disability
- Indigenous electors (62% versus 75% of non-Indigenous electors); among First Nations electors, those living on a First Nations reserve were less likely to feel very informed than those who do not live on a reserve (47% versus 65%)
- new Canadians (67% compared to 76% of those who became citizens before the 2015 election and 74% of Canadians by birth)
- 18- to 24-year-olds (55% versus 65% of 25- to 34-year-olds and 77% of electors aged 35 and older)
The following were more likely to say they felt very informed:
- electors who received a VIC (76% versus 45% of those who did not)
- those who recalled seeing EC advertising (96% versus 47% of those who did not)
- those who voted in the 2021 general election (76% versus 43% of non-voters) and those who voted in the 2019 general election (76% versus 46% of those who were eligible but did not vote)
- Canadians interested in politics (76% versus 56% of those not interested in politics)
Vast majority felt informed about health and safety measures in place at the polls
Respondents were asked how well informed they felt they were about the health and safety measures for COVID-19 that were in place at the polls for this election. Early in the election period, two-thirds (68%) of electors said they felt at least somewhat informed about the COVID-19 safety measures at the polls, including a third (35%) who felt very informed. The proportions of electors who felt informed about the safety measures increased over the course of the election period: post-election, nine in 10 (89%) electors said they felt at least somewhat informed about these measures, including six in 10 (60%) who felt very well informed. Few (9%) felt uninformed about the health and safety measures.
Figure 13: How informed electors felt about COVID-19 safety measures at the polls

Text version of "Figure 13: How informed electors felt about COVID-19 safety measures at the polls"
This stacked vertical bar chart compares the level to which electors felt informed about COVID-19 safety measures in place at the polls. Results are displayed across the various phases of the election period as follows:
- Early election phase:
- Very informed: 35 percent
- Somewhat informed: 32 percent
- Not very informed: 21 percent
- Not at all informed: 9 percent
- Registration phase:
- Very informed: 35 percent
- Somewhat informed: 33 percent
- Not very informed: 21 percent
- Not at all informed: 8 percent
- VIC phase:
- Very informed: 39 percent
- Somewhat informed: 33 percent
- Not very informed: 19 percent
- Not at all informed: 7 percent
- Early voting phase:
- Very informed: 49 percent
- Somewhat informed: 31 percent
- Not very informed: 14 percent
- Not at all informed: 5 percent
- Election day phase:
- Very informed: 55 percent
- Somewhat informed: 30 percent
- Not very informed: 10 percent
- Not at all informed: 4 percent
- Post-election:
- Very informed: 60 percent
- Somewhat informed: 29 percent
- Not very informed: 7 percent
- Not at all informed: 3 percent
Q. How well informed do you feel you are about the health and safety measures for COVID-19 that are in place at the polls for this election? [WAVE 1] / How well informed do you feel you were about the health and safety measures for COVID-19 that were in place at the polls for this election? Base: all respondents [WAVE 2]
Among post-election survey respondents, the following subgroups were less likely to report feeling very informed about the health and safety measures in place:
- electors with a disability (55% versus 63% of electors with no disability)
- Indigenous electors (54% versus 61% of non-Indigenous electors)
- 18- to 34-year-olds (46% versus 55% of 35- to 54-year-olds and 71% of electors aged 55 and older)
- youth attending school (42% versus 48% of youth working full-time, 48% of NEET youth and 47% of other youth)
- electors living in urban areas (61% versus 65% of those living in rural areas)
- visible minorities (55% versus 61% of electors who are not a visible minority)
- non-binary and transgender electors (37% versus 62% of women and 59% of men)
7. Knowledge of and Interest in Employment Opportunities
This section reports findings related to electors' awareness of and interest in employment opportunities with Elections Canada during federal elections.
More electors are aware that people from the general public can work at polls than know these are paid positions
Nearly nine in 10 electors (87%) surveyed during the election period were aware that people from the general public can be hired to work at the polls during a federal election. Fewer, however, were aware that people who work at the polls during an election are paid for this work: approximately two-thirds (64%) correctly responded that the statement was true. These proportions did not meaningfully change over the course of the election period. These findings are aligned with those found during the 2019 election period survey, where more respondents were aware that people from the general public can work at polls than know these are paid positions.
Figure 14: Knowledge of employment opportunities

Text version of "Figure 14: Knowledge of employment opportunities"
This horizontal clustered bar chart displays electors' knowledge of employment opportunities during a federal election. A split sample was used, and the breakdown is presented as follows:
- Split sample one "People from the general public can be hired to work at the polls":
- True: 87 percent
- False: 2 percent
- Don't know: 10 percent
- Split sample two "People who work at polls are paid"
- True: 64 percent
- False: 20 percent
- Don't know: 16 percent
Q. Is this true or false? In a federal election, people from the general public can be hired to work at the polls. [SPLIT SAMPLE]
Q. Is this true or false? In a federal election, the people who work at the polls are paid. [SPLIT SAMPLE] Base: all respondents [WAVE 1]
The following subgroups were less likely to know that people who work at the polls are paid:
- electors with a disability (62% versus 66% of those without a disability), specifically those with a severe or very severe disability (59%)
- Indigenous electors (57% versus 65% of non-Indigenous electors)
- immigrants who became citizens after the 2015 general election (48%) as well as those who became citizens before the 2015 election (58%) compared with Canadians by birth (66%)
- 18- to 24-year-olds (52%) and 25- to 34-year-olds (54%) compared with electors aged 35 and older (68%)
- NEET youth aged 18 to 34 (46%) and youth working full-time (51%) compared with youth attending school (57%)
- visible minorities (56% versus 66% of other electors)
- electors who have completed high school or less (57% versus 68% of university graduates and 62% of those with some post-secondary or college)
The following subgroups were more likely to know that people who work at the polls are paid:
- seniors aged 65 and older (79% versus 59% of electors between the ages of 18 and 64)
- electors in Quebec (79%) and the Atlantic provinces (67%) compared with other provinces (results range from 57% to 62%)
- electors who recalled seeing EC advertising (67% versus 62% of those who did not)
Interest in working at the polls decreased given the proposition of working during a pandemic
A split sample was used to compare electors' interest in working at the polls during a federal election. For half the election period survey respondents, the question was framed as an opportunity for paid work. The other half of respondents were asked about their level of interest in working at the polls after being informed about the health and safety measures that had been put in place to keep poll workers safe in response to the COVID-19 pandemic.
Figure 15: Interest in employment opportunities

Text version of "Figure 15: Interest in employment opportunities"
Two vertical bar charts compare findings from a split sample assessing electors' interest in employment opportunities with Elections Canada. The breakdown is as follows:
- Split sample one: "Elections Canada hires and pays local people to work at the polls in their area. How interested would you be in working at the polls in the election?"
- Very interested: 18 percent
- Somewhat interested: 25 percent
- Not very interested: 25 percent
- Not at all interested: 30 percent
- Split sample two: "Due to the pandemic, Elections Canada has put health and safety measures in place at every polling place to keep workers and electors safe in this election. How interested would you be in working at the polls in the election?"
- Very interested: 14 percent
- Somewhat interested: 22 percent
- Not very interested: 26 percent
- Not at all interested: 36 percent
[LEFT] Q. During an election, Elections Canada hires and pays local people to work at the polls in their area. How interested would you be in working at the polls in the election? Base: 13,745; all respondents. [SPLIT SAMPLES] [WAVE 1]
[RIGHT] Q. Due to the pandemic, Elections Canada has put health and safety measures in place at every polling place to keep workers and electors safe in this election. How interested would you be in working at the polls in the election? Base: 13,228; all respondents. [SPLIT SAMPLES] [WAVE 1]
Those who were informed that Elections Canada hires and pays local people to work at the polls were more likely to express interest in the employment opportunity: 43% were somewhat or very interested in the opportunity. This marks a decrease in interest in the opportunity to work at the polls for pay compared with early in the 2019 election period (51%).
Fewer (36%) electors in 2021 expressed at least some interest in working at the polls when the preamble mentioned the health and safety measures put in place at the polls to keep workers and electors safe in the election due to the pandemic. The same proportion (36%) said they were not at all interested in working when the health and safety measures at the polls were mentioned.
Among electors informed that Elections Canada pays people to work at the polls, the following groups were more likely to express interest in working:
- new Canadians (56% compared to 49% of those who became citizens before the 2015 election and 42% of Canadians by birth)
- visible minorities (55% versus 42% of electors who are not a visible minority)
- women (47% versus 40% of men)
- electors with a disability (48% versus 40% of those with no disability)
- 18- to 24-year-olds (54% versus 40% of 25- to 34-year-olds and 43% of those aged 35 and older)
- youth aged 18 to 34 attending school (58%) and NEET youth (52%) compared with youth working full-time (35%)
- Canadians aged 65 and over (46% versus 42% of those aged 18 to 64)
- electors in the Atlantic provinces (47%), Ontario (46%) and the Prairies (45%) compared with those in Quebec (40%)
Among those informed that health and safety measures had been put in place at the polls, the following were more likely to be interested in working:
- new Canadians (56%) along with Canadians who became citizens before the 2015 election (43%) compared to Canadians by birth (34%)
- visible minorities (49% versus 34% of electors who are not a visible minority)
- those with a disability (40% versus 33% of electors with no disability)
- Indigenous electors (41% versus 36% of non-Indigenous electors)
- 18- to 24-year-olds (42% versus 32% of 25- to 34-year-olds and 36% of those aged 35 and older)
- Canadians aged 65 and over (39% versus 35% of those aged 18 to 64)
- electors who had been vaccinated with at least one dose of a COVID-19 vaccine (37%) compared with those who had not (33%)
8. Voter Registration: Knowledge and Actions
This section reports findings related to electors' knowledge of voter registration requirements, their awareness of the different ways they can use to register, update or check their registration information, and whether they did anything to make sure they were registered to vote in this election.
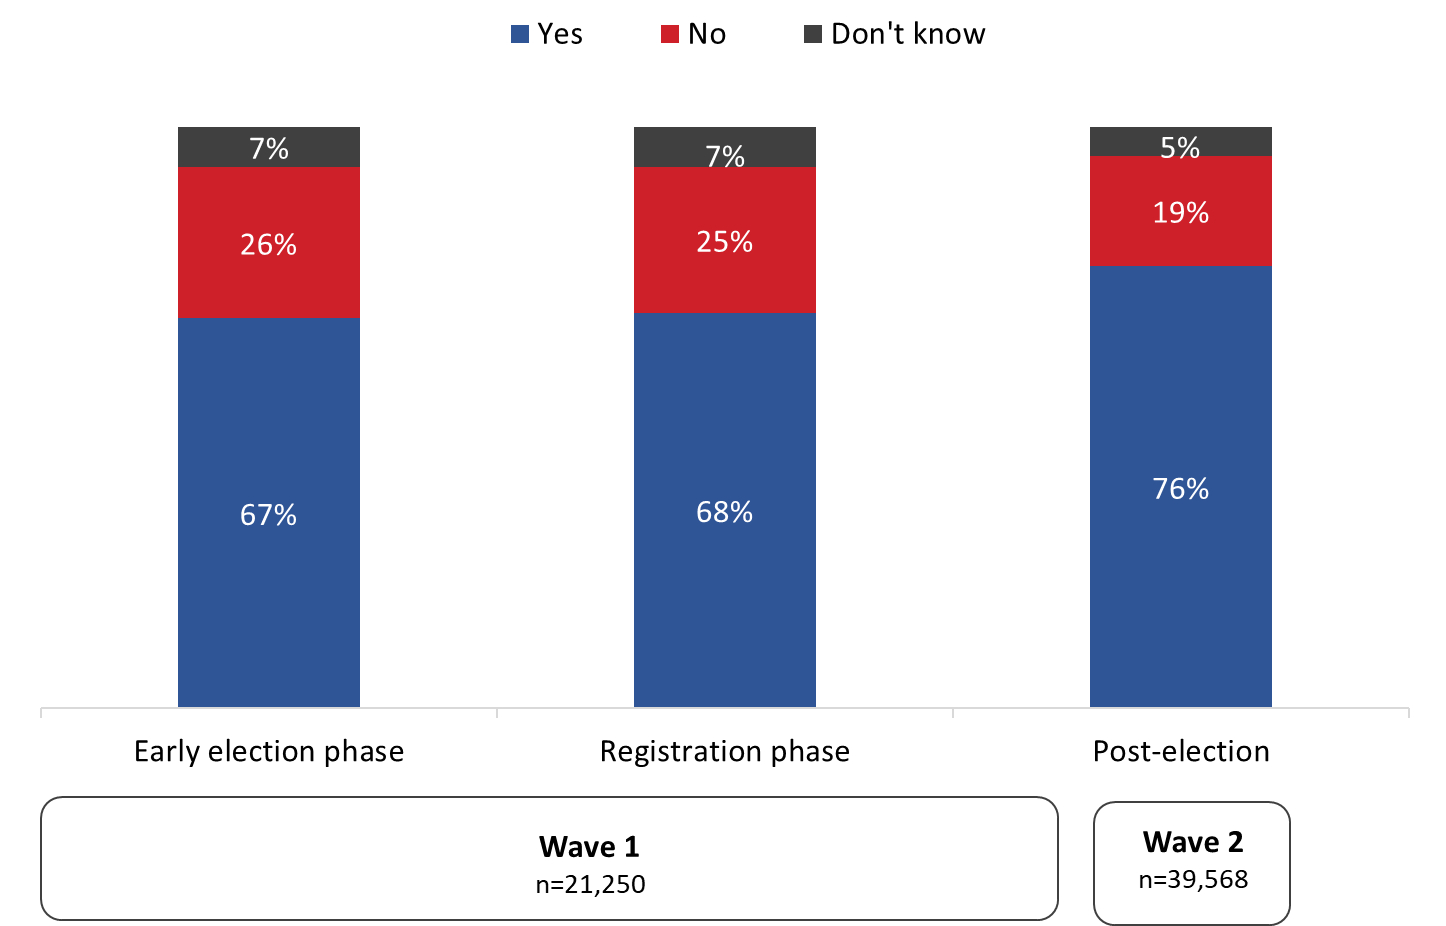
Many electors are aware that voter registration information must be updated
Two-thirds (67%) of electors in the early election phase knew of the need to update their voter registration if their information changes. This remained stable through the registration phase, increasing by just one percentage point (68%), before increasing to three-quarters (76%) of respondents in the post-election survey.
Awareness of the need to update voter registration information if it changes was lower in 2021 (76% aware post-election) as compared to the 2019 NES post-election survey, when 87% of electors said they were aware of this requirement. A longer voter information campaign may have contributed to the higher level of awareness in 2019: due to the known fixed date of the election, advertising about registration began before the start of the election period. In 2021, where the election date was not known in advance, advertising could begin only after the election period had begun; this resulted in a shorter registration phase and some registration ads being blended with messages from the VIC phase.
Figure 16: Knowledge of need to update registration
Text version of "Figure 16: Knowledge of need to update registration"
This stacked vertical bar chart displays electors' knowledge of the need to update their voter registration following changes to their information. Results were collected and are displayed across three election phases as follows:
- Early election phase
- Yes: 67 percent
- No: 26 percent
- Don't know: 7 percent
- Registration phase
- Yes: 68 percent
- No: 25 percent
- Don't know: 7 percent
- Post-election
- Yes: 76 percent
- No: 19 percent
- Don't know: 5 percent
Q. To the best of your knowledge, do you need to update your voter registration if your information changes for example, if you moved or changed your name? Base: all respondents [WAVE 1, WAVE 2]
Among post-election survey respondents, the following groups were more likely to know about the requirement to update one's voter registration if their information changes:
- new Canadians (81%) compared with Canadians by birth (76%) and those who became citizens before the 2015 general election (76%)
- youth aged 18 to 24 (83%) and 25 to 34 (81%) compared with those 35 and older (74%)
- electors who had moved in the last 12 months (81% versus 75% of those who had not)
- electors who recalled EC advertising or communications (78% versus 72% of those who did not)
- electors in Quebec (81%) followed by electors in BC (77%) compared with other provinces (a range of 73% to 74%)
In addition, the following groups of electors were less likely to know about the need to update their voter registration:
- Indigenous electors (72% versus 76% of non-Indigenous electors)
- those who received their VIC (76% versus 78% of those who did not)
- non-voters (71% versus 77% of those who said they voted in 2021)
- those eligible to vote in 2019 but who did not (73% versus 76% of voters)
- electors not interested in politics (74% versus 76% of those interested)
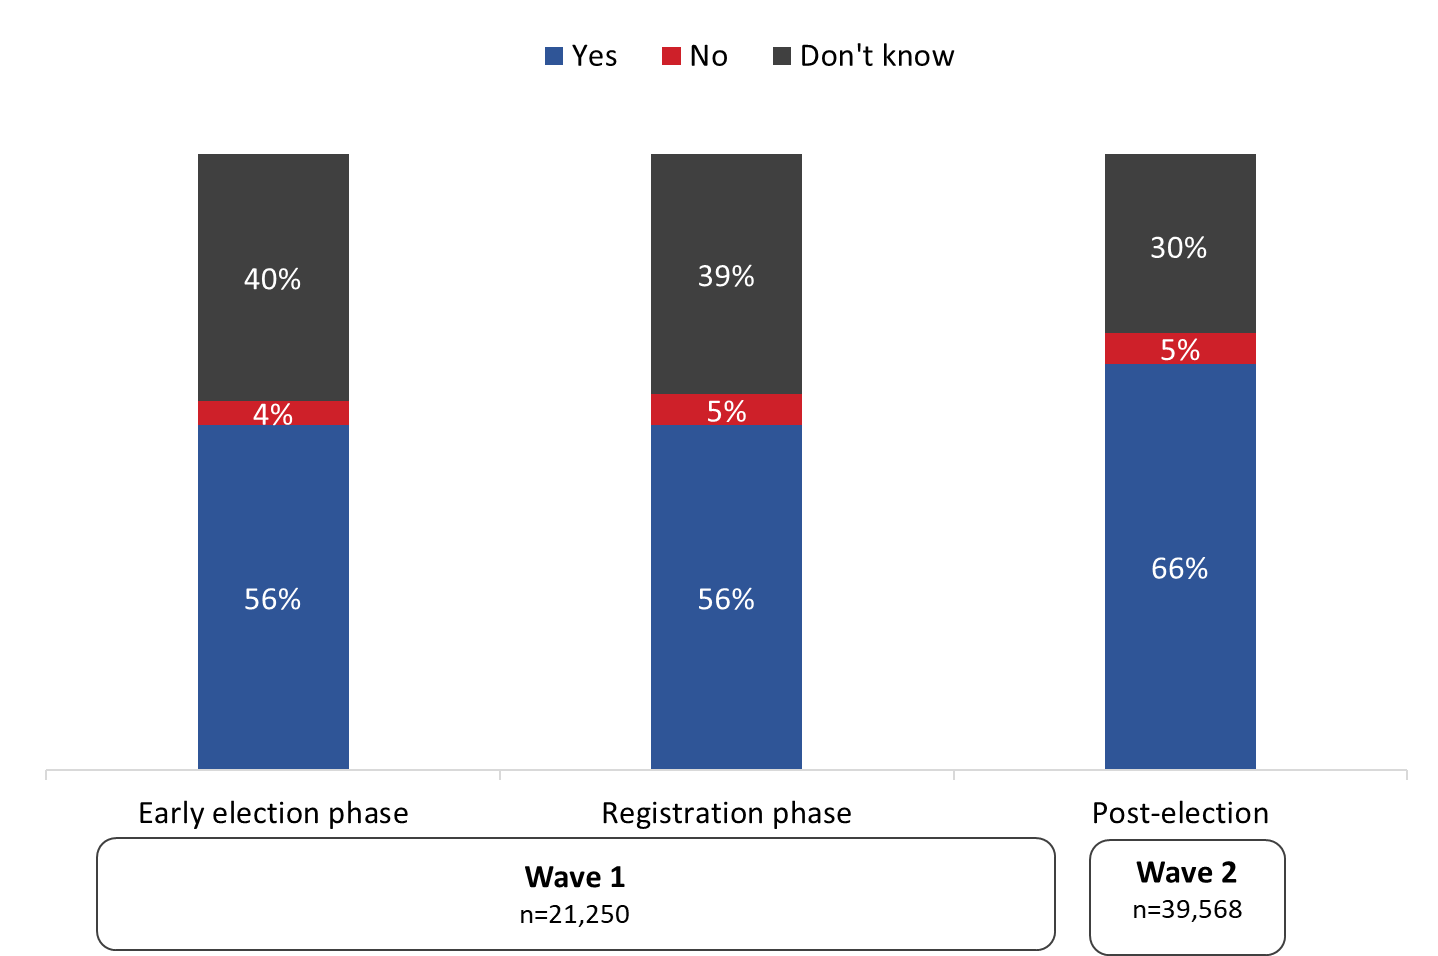
Two-thirds are aware that voter registration information can be updated/completed on EC's website
Two-thirds of electors (66%) who completed the post-election survey were aware that Canadians can check, update or complete their voter registration on Elections Canada's website. This is up 10 percentage points from awareness recorded in the early election and registration phases of the election period, when just over half (56% each) noted this was possible. Worthy of mention, a significant minority of respondents said they did not know if it was possible to update voter registration online: 40% during the early election phase and 39% during the registration phase, decreasing to 30% in the post-election survey.
Figure 17: Knowledge of online voter registration service
Text version of "Figure 17: Knowledge of online voter registration service"
This stacked vertical bar chart displays electors' knowledge of the ability to check, update or complete their voter registration on Elections Canada's website. Results were collected and are displayed across three election phases as follows:
- Early election phase
- Yes: 56 percent
- No: 4 percent
- Don't know: 40 percent
- Registration phase
- Yes: 56 percent
- No: 5 percent
- Don't know: 39 percent
- Post-election
- Yes: 66 percent
- No: 5 percent
- Don't know: 30 percent
Q. To the best of your knowledge, is it possible for Canadian electors to check, update or complete their voter registration on Elections Canada's website? Base: all respondents [WAVE 1, WAVE 2]
Knowledge that Elections Canada's website can be used to check, update or complete voter registration followed a similar pattern to awareness of the need to update voter information. Specifically, Indigenous electors, non-voters in 2021 and eligible non-voters in 2019, and those not interested in politics were less likely to know that Canadians can check, update or complete their voter registration on Elections Canada's website.
In addition, the following post-election survey respondents were less likely to be aware that electors can update or complete their voter registration on EC's website: electors who did not feel informed about when, where and how to vote (48% versus 67% of those who did) and those who expected voting to be difficult during the election period (58% versus 67% who expected it to be easy).
The following were more likely to be aware of online voter registration:
- new Canadians (75% versus 63% of those who became citizens before the 2015 general election)
- youth aged 18 to 24 (76%) and 25 to 34 (70%) versus those aged 35 and older (64%)
- youth aged 18 to 34 attending school (78%) versus NEET youth (70%)
- electors who had moved in the last 12 months (73%) versus those who had not (65%)
- electors who recalled EC advertising or communications (69% versus 55% of those who did not)
Knowledge of polling day registration increased by post-election phase
Between the early election and registration phases of the campaign survey, awareness of polling day registration did not change significantly (61% and 59%, respectively). Post-election awareness of polling day registration, however, increased significantly: 71% said that if an elector is not registered on election day and wants to vote, they can register at the polling place and then vote immediately after. Post-election awareness is identical to what was recorded following the 2019 general election, when 71% claimed to know that electors can register at the polling place on election day.
Figure 18: Knowledge of polling day registration

Text version of "Figure 18: Knowledge of polling day registration"
This stacked vertical bar chart displays electors' knowledge of the ability to register to vote on election day at the polling place. Results were collected and are displayed across three election phases as follows:
- Early election phase
- Yes: 61 percent
- No: 11 percent
- Don't know: 29 percent
- Registration phase
- Yes: 59 percent
- No: 10 percent
- Don't know: 30 percent
- Post-election
- Yes: 71 percent
- No: 8 percent
- Don't know: 20 percent
Q. If an elector is not registered on election day and wants to vote, can they register at the polling place and then vote immediately after?
Base: all respondents. [WAVE 1, WAVE 2]
As in previous surveys of electors, knowledge that electors can register at the polling place on election day was much lower among electors in Quebec (56%) compared with all other provinces (results range from 75% to 80%). A possible explanation for this is that provincial elections in Quebec do not allow electors to register at the polls before voting on election day, while elections in all other jurisdictions allow for this in some form.
In addition, the following groups of electors were less likely to know about polling day registration:
- new Canadians (64% versus 72% of Canadians by birth)
- 18- to 24-year-olds (67% versus 71% of 25- to 34-year-olds and 72% of those aged 35 and older)
- NEET youth (65% versus 70% of youth attending school and 72% of youth working full-time)
- First Nations electors who live on a reserve (55%) compared with First Nations electors who did not live on a reserve (75%)
- electors who did not feel informed about when, where and how to vote (55% versus 72% of those who did)
- those who expected voting to be difficult (64% versus 73% who expected it to be easy)
- non-voters (55% versus 73% of voters)
The following were more likely to know about polling day registration:
- electors who had moved in the last 12 months (74% versus 71% of those who had not moved)
- electors who recalled EC advertising or communications (74% versus 63% of those who did not)
- electors who did not receive a VIC (78% versus 71% of those who did)
One-half made sure they were registered to vote
In the post-election survey, one-half (51%) of electors said they had made sure they were registered to vote in the election: 41% said they checked that they were already registered to vote; 8% said they updated their registration information; and 6% said they registered to vote recently.
The proportions of electors who checked that they were already registered to vote increased over the course of the voter information campaign. During the early election phase, just 9% of electors aware of the election had checked their voter registration. This increased to 17% by the VIC phase of the campaign and nearly doubled by the early voting and election day phases (30% and 33%, respectively). The proportions who reported that they had registered recently also increased modestly from 4% in the early election phase to 9% by the election day phase.
Figure 19: Registration actions
| Registration actions | Wave 1 (n=53,731) |
Wave 2 (n=39,516) | ||||
|---|---|---|---|---|---|---|
| Early election phase | Registration phase | VIC phase | Early voting phase | Election day phase | Post-election | |
| Check that you are already registered | 9% | 11% | 17% | 30% | 33% | 41% |
| Update your registration information | 5% | 5% | 5% | 6% | 6% | 8% |
| Register to vote recently | 4% | 4% | 5% | 7% | 9% | 6% |
| Did none of the above | 80% | 78% | 71% | 55% | 50% | 48% |
| Don't know | 3% | 2% | 2% | 2% | 2% | 1% |
Q. What, if anything, did you do to make sure you were registered to vote in this election? Did you...?
Base: those aware of the election [WAVE 1, WAVE 2].
Post-election, electors were more likely to have checked that they were already registered when they had recalled EC advertising or communications (41% versus 28% of those who had not) and when they had received a VIC (37% versus 28% of those who had not).
9. Knowledge of Identification Requirements
This section of the report presents electors' aided knowledge of the identification requirements for voting in a Canadian federal election.
While the vast majority (93%) of electors surveyed during the early election phase said they were aware that voters have to present a proof of identity in order to vote, awareness did increase modestly through the election period. By the early voting phase, awareness of the requirement to provide a proof of identity had increased to 96% before reaching a high of 97% during the election day phase and remained stable through the post-election survey. Post-election awareness reached the same level it did following the 2021 and 2019 federal general elections.
Figure 20: Knowledge of proof-of-identity requirements

Text version of "Figure 20: Knowledge of proof-of-identity requirements"
This stacked vertical bar chart displays electors' knowledge of the need to present a proof of identity in order to vote in a federal election. Results are displayed across the various phases of the election period as follows:
- Early election phase
- Yes: 93 percent
- No: 4 percent
- Don't know: 3 percent
- Registration phase
- Yes: 93 percent
- No: 4 percent
- Don't know: 3 percent
- VIC phase
- Yes: 94 percent
- No: 4 percent
- Don't know: 2 percent
- Early voting phase
- Yes: 96 percent
- No: 3 percent
- Don't know: 2 percent
- Election day phase
- Yes: 97 percent
- No: 2 percent
- Don't know: 1 percent
- Post-election
- Yes: 97 percent
- No: 2 percent
- Don't know: 1 percent
Q. To the best of your knowledge, do voters have to present a proof of identity in order to vote in a Canadian federal election?
Base: all respondents [WAVE 1, WAVE 2]
Among post-election survey respondents, the following were less likely to correctly identify that a proof of identity is required to vote in a Canadian federal election:
- Indigenous electors (94% versus 97% of non-Indigenous electors)
- First Nations electors who live on a reserve (87% versus 94% of First Nations electors who did not live on a reserve)
- non-voters (91% versus 97% of Canadians who voted in the 2021 GE)
- electors who were eligible to vote in 2019 but did not (91% versus 97% of those who voted)
- electors who did not feel informed about when, where and how to vote (92% versus 97% of those who did)
Awareness of a proof of residence requirement increased through election period
Electors' awareness of the need to provide a proof of address to vote in a Canadian federal election was slightly lower than their knowledge of a proof of identity, but still very high at 89% in the post-election surveya slight decline from the 2019 election (91%) but in line with 2015 (88%). Awareness, moreover, increased over the election period, from 83% during the early election and registration phases to 89% by the VIC phase, before reaching 90% during the early voting and election day phases.
Figure 21: Knowledge of proof of residence

Text version of "Figure 21: Knowledge of proof of residence"
This stacked vertical bar chart displays electors' knowledge of the need to present a proof of address in order to vote in a federal election. Results are displayed across the various phases of the election period as follows:
- Early election phase
- Yes: 83 percent
- No: 8 percent
- Don't know: 9 percent
- Registration phase
- Yes: 83 percent
- No: 8 percent
- Don't know: 9 percent
- VIC phase
- Yes: 89 percent
- No: 7 percent
- Don't know: 4 percent
- Early voting phase
- Yes: 90 percent
- No: 6 percent
- Don't know: 4 percent
- Election day phase
- Yes: 90 percent
- No: 6 percent
- Don't know: 3 percent
- Post-election
- Yes: 89 percent
- No: 7 percent
- Don't know: 4 percent
Q. To the best of your knowledge, do voters have to present a proof of address in order to vote in a Canadian federal election? Base: all respondents [WAVE 1, WAVE 2]
Post-election, the following subgroups of electors were less likely to be aware that a proof of address is required to vote:
- Indigenous electors (86% versus 89% of non-Indigenous electors)
- First Nations electors who live on a reserve (77% versus 86% of First Nations electors who did not live on a reserve)
- new Canadians (83% versus 86% of those who became citizens before the 2015 general election and 89% of Canadians by birth)
- those who did not recall any advertising or communications from Elections Canada (85% versus 90% of those who did)
- those who did not receive a VIC (87% versus 89% of those who did)
- non-voters in 2021 (80% versus 89% of voters) and in 2019 (81% versus 89% of voters)
- those not interested in politics (87% versus 89% of those interested in politics)
- electors who did not feel informed about when, where and how to vote (82% versus 89% of those who did)
10. Knowledge of Voting Methods
Electors' knowledge of the voting methods available in a federal election was measured in both an unaided and aided manner. The results are presented in this section.
Majorities aware that electors can vote on election day, by mail and at advance polls
Post-election survey respondents from the discrete telephone sample were asked, in an open-ended manner, to identify the current ways that electors can vote in a federal election. Awareness of in-person voting on election day was highest (88%), followed by seven in 10 (70%) who said electors can vote by mail and six in 10 (61%) who mentioned that electors can vote at an advance polling station.
Compared to results from the 2019 NES and 2015 Survey of Electors, knowledge of voting on election day declined slightly (from 91% in 2019 and 90% in 2015). There was also a decline in electors' knowledge of the option to vote at an advance poll (from 71% in 2019 and 64% in 2015). On the other hand, knowledge of the option to vote by mail recorded a historic high for Elections Canada's post-election surveys, having increased significantly amid the COVID-19 pandemic from the previous high of 23% in 2019 and from 13% in 2015.
Figure 22: Unaided knowledge of different ways to vote

Text version of "Figure 22: Unaided knowledge of different ways to vote"
This horizontal bar chart shows electors' knowledge of the current ways to vote in a federal election. The breakdown is as follows:
- Total
- On election day: 88 percent
- By mail: 70 percent
- At an advanced polling station: 61 percent
- Online: 8 percent
- At a local EC office: 3 percent
- Special ballot: 2 percent
- By proxy: 2 percent
- At home: 1 percent
- By telephone: 1 percent
- By computer / electronically: 1 percent
- Some post-secondary campuses: less than 0.5 percent
- Other: 5 percent
- Don't know: 4 percent
Q. To the best of your knowledge, what are the current ways that electors can vote in a federal election? [Multiple responses accepted] Base: 1,560; all phone respondents [WAVE 2 phone respondents]
Among post-election respondents, notable subgroup differences included the following:
- Electors with a disability were less likely to mention in person on election day (83% versus 90% of electors without a disability) and by mail (65% versus 72%).
- Indigenous electors were less likely to be aware of the option to vote at an advance polling station (49% versus 62% of non-Indigenous electors) and by mail (53% versus 71%).
- New Canadians were less likely to mention in person on election day (73% versus 81% of those who became citizens before the 2015 general election and 90% of Canadians by birth), at an advance polling station (35% versus 53% and 64%) and by mail (40% versus 62% and 72%).
- 18- to 24-year-olds were less likely to be aware of the option to vote at an advance poll (42% versus 54% of 25- to 34-year-olds and 65% of those aged 35 and older).
- Electors who received a VIC were more likely to be aware of the option to vote at an advance polling station (65% versus 43% of those who did not receive a VIC) and by mail (73% versus 55%).
In addition, those who voted in 2021, those who voted in 2019, those interested in politics and those who felt informed about when, where and ways to vote were more likely than their counterparts to be knowledgeable of the options to vote in person on election day, at an advance poll and by mail.
Most electors recognized the main early voting options when aided
Throughout the election period and post-election surveys, online respondents were asked to identify from a list the various ways in which it is possible to vote besides at the polling station on election day. Post-election, 94% of electors knew it is possible to vote at an advance polling station, followed by 91% who identified voting by mail and half (50%) who mentioned voting at a local Elections Canada office. Awareness of the option to vote at an advance poll was highest overall across all phases of the campaign survey, while awareness of voting by mail steadily increased during the campaign survey (from 64% during the early election phase to 76% by the early voting phase).
Post-election levels of aided knowledge of voting at advance polls and at a local Elections Canada office were similar to the results obtained following the 2019 election (92% for advance polls and 50% for the local office). In contrast, aided knowledge of the option to vote by mail increased significantly since the 2019 NES, when 39% of post-election survey respondents said it is possible to vote by mail.
Figure 23: Aided knowledge of different ways to vote
| Ways to vote | Wave 1 (n=44,329) |
Wave 2 (n=31,621) |
|||
|---|---|---|---|---|---|
| Early election phase | Registration phase | VIC phase | Early voting phase | Post-election | |
| At an advance polling station | 85% | 84% | 86% | 89% | 94% |
| By mail | 64% | 65% | 71% | 76% | 91% |
| At a local Elections Canada office | 36% | 35% | 39% | 42% | 50% |
| Online (not available in a federal election) | 9% | 9% | 9% | 8% | 7% |
| By telephone (not available in a federal election) | 4% | 4% | 3% | 3% | 3% |
| None of the above | 1% | 1% | 1% | 1% | 1% |
| Don't know | 8% | 8% | 6% | 4% | 1% |
Q. Besides voting in person at the polling station on election day, is it possible to vote in the following ways? [Multiple responses accepted]
Base: all respondents [WAVE 1, WAVE 2]
Among post-election respondents, notable subgroup differences included the following:
- Indigenous electors were less likely than non-Indigenous electors to identify voting at an advance polling station (87% versus 95%), by mail (83% versus 92%) or at a local Elections Canada office (46% versus 51%).
- Canadians by birth were more likely to identify advance polling stations (95% versus 91% of new Canadians and 92% of those who became citizens before the 2015 federal general election), by mail (92% versus 88% of those who became citizens before the 2015 federal general election) and at a local Elections Canada office (51% versus 48% of those who became citizens before the 2015 federal general election).
- Youth 18 to 34 attending school (94%), along with youth working full-time (92%), were more likely to identify voting by mail compared to NEET youth (87%).
In addition, those who recalled EC advertising, those who voted in 2021, those who voted in 2019, those interested in politics and those who felt informed about when, where and ways to vote were more likely than their counterparts to say it is possible to vote at an advance poll, by mail and at a local Elections Canada office.
11. Awareness and Perceptions of Elections Canada
This section presents results on electors' awareness of and trust in Elections Canada as a source for electoral information during the 2021 GE.
EC top of mind as a source for electoral information
Elections Canada was the top-of-mind source of electoral information for electors in both the election period and the post-election surveys, with recognition being higher after the election. Forty-two percent of electors surveyed during the election period identified EC as the organization that first comes to mind when looking for information on when, where and how to vote; by the post-election survey, this had climbed to 66%, a 24-point increase. This also represents a small increase from the 2019 election, when 62% of electors in the post-election survey said Elections Canada first comes to mind. One-third (32%) of those surveyed during the election period could not identify any organization as a source of electoral information; this proportion decreased to one-fifth (20%) of respondents post-election.
Other sources were mentioned by significantly smaller numbers and can be found below in figure 24.
Figure 24: Top-of-mind organization for electoral information

Text version of "Figure 24: Top-of-mind organization for electoral information"
The horizontal bar compares top-of-mind organizations identified by respondents when searching for information on the voting process. Results are displayed as a comparison between the election period phase and the post-election phase. The breakdown is as follows:
- Post-election:
- Elections Canada: 66 percent
- Media: 2 percent
- Federal government: 4 percent
- Internet: 3 percent
- Mail / voter card: 2 percent
- Local candidate / political party: 2 percent
- City hall / municipal government: 1 percent
- Provincial / Territorial EMB / Elections agency: less than 0.5 percent
- Provincial government: less than 0.5 percent
- Other: 1 percent
- Don't know: 20 percent
- Election period
- Elections Canada: 42 percent
- Media: 6 percent
- Federal government: 5 percent
- Internet: 5 percent
- Mail / voter card: 3 percent
- Local candidate / political party: 2 percent
- City hall / municipal government: 1 percent
- Provincial / Territorial EMB / Elections agency: less than 0.5 percent
- Provincial government: less than 0.5 percent
- Other: 1 percent
- Don't know: 32 percent
Q. When you think about getting information about when and where to vote, or any other information on the voting process, who or which organization first comes to mind? Base: all respondents [WAVE 1, WAVE 2]
Post-election, the following subgroups of electors were less likely to identify Elections Canada as the organization that first comes to mind as a source of information on the voting process:
- electors with a disability (61% versus 69% of those without a disability)
- Indigenous electors (52% versus 67% of non-Indigenous electors)
- First Nations electors who live on a reserve (24% versus 59% of First Nations electors not living on a reserve)
- Canadians by birth (66%) and those who became citizens before the 2015 general election (67%) compared to new Canadians (72%)
- 18- to 24-year-olds (59% versus 64% of 25- to 34-year-olds and 67% of those aged 35 and older)
- NEET youth (54% compared to 61% of youth aged 18 to 34 working full-time, 66% of youth attending school and 64% of all other youth)
- rural electors (60%) compared with urban electors (69%)
Those who recalled advertising or communications from Elections Canada, those who received their VIC, those who voted in 2021, those who voted in 2019, those interested in politics and those who felt informed about when, where and how to vote were more likely than their counterparts to point to Elections Canada as a source of information about the voting process.
Widespread agreement that Elections Canada is the most trusted source of information about the electoral process
More than nine in 10 (93%) electors in the post-election survey agreed that Elections Canada is the most trusted source for information about the electoral process (up from 89% during the election period). This includes nearly three-quarters (72%) who strongly agreed with the statement.
Figure 25: Trust in Elections Canada as a source of information
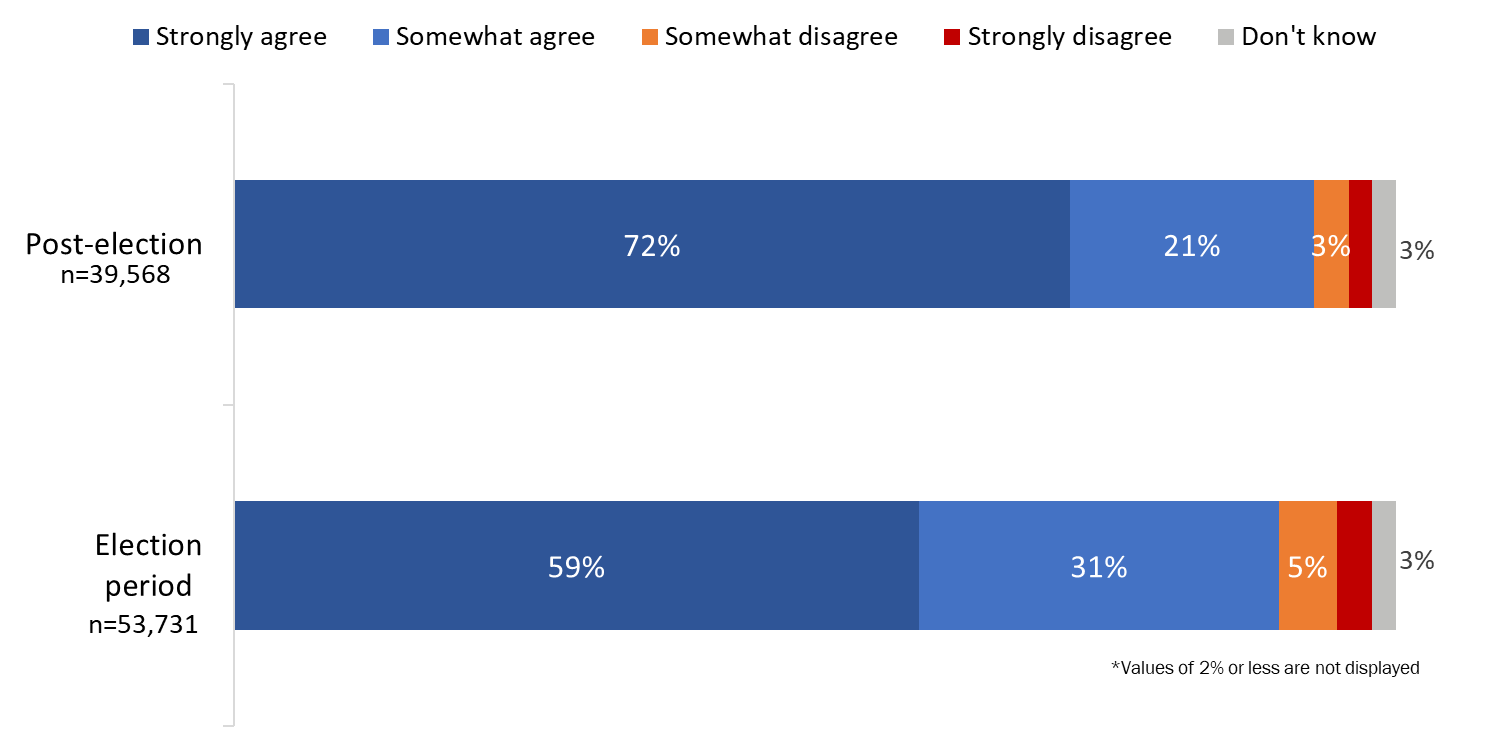
Text version of "Figure 25: Trust in Elections Canada as a source of information"
This stacked horizontal bar chart shows respondents' level of trust in Elections Canada as a source of information about the electoral process. The breakdown is as follows:
- Total
- Post-election
- Strongly agree: 72 percent
- Somewhat agree: 21 percent
- Somewhat disagree: 3 percent
- Strongly disagree: 2 percent
- Don't know: 3 percent
- Election period
- Strongly agree: 59 percent
- Somewhat agree: 31 percent
- Somewhat disagree: 5 percent
- Strongly disagree: 3 percent
- Don't know: 3 percent
- Post-election
Q. How strongly do you agree or disagree that Elections Canada is the most trusted source of information about the electoral process?
Base: all respondents [WAVE 1, WAVE 2]
While the proportion of electors who agreed at least somewhat that Elections Canada is the most trusted source of information increased modestly from the 2019 NES post-election survey (91%), the proportion who strongly agreed increased significantly, from 57% in 2019 to 72% in 2021.
Among post-election respondents, the following subgroups of electors were less likely to agree strongly that Elections Canada is the most trusted source of information about the electoral process:
- electors with a disability (68% versus 75% of those without a disability)
- Indigenous electors (61% versus 74% of non-Indigenous electors)
- First Nations electors living on a reserve (48% versus 65% of First Nations electors not living on a reserve)
- Canadians by birth (72% versus 76% of those who became citizens before the 2015 federal election and 79% of new Canadians)
- 18- to 34-year-olds (69% versus 74% of Canadians aged 35 and older)
- NEET youth (61% versus 72% of youth attending school, 69% of youth working full-time and 69% of all other youth)
- rural electors (68% versus 75% of urban electors)
- those with a high school or less education (57% versus 67% of those with some post-secondary or college and 80% of those who have completed university)
On the other hand, those who recalled advertising or communications from Elections Canada, those who received their VIC, those who voted in 2021, those who voted in 2019, those interested in politics and those who felt informed about when, where and ways to vote were more likely than their counterparts to strongly agree that Elections Canada is the most trusted source of information about the electoral process.
12. Profile of Survey Respondents
| Base | Wave 1 n=53,731 |
Wave 2 n=39,568 |
|
|---|---|---|---|
| Province/territory | [weighted data] | ||
| Newfoundland and Labrador | 1% | 1% | |
| Prince Edward Island | 0.5% | 0.5% | |
| Nova Scotia | 4% | 4% | |
| New Brunswick | 2% | 2% | |
| Quebec | 23% | 22% | |
| Ontario | 38% | 39% | |
| Manitoba | 4% | 4% | |
| Saskatchewan | 3% | 3% | |
| Alberta | 11% | 11% | |
| British Columbia | 14% | 14% | |
| Nunavut | <0.5% | <0.5% | |
| Northwest Territories | <0.5% | <0.5% | |
| Yukon | <0.5% | <0.5% | |
| Indigenous | |||
| First Nations | 1% | 2% | |
| Métis | 2% | 2% | |
| Inuit | <0.5% | <0.5% | |
| Non-Indigenous | 94% | 94% | |
| Prefer not to answer | 3% | 3% | |
| Gender | |||
| Female | 49% | 50% | |
| Male | 48% | 47% | |
| Non-binary/transgender | 1% | 1% | |
| Prefer not to answer | 2% | 2% | |
| Language spoken at home | |||
| English | 77% | 78% | |
| French | 20% | 19% | |
| Other | 3% | 3% | |
| Prefer not to answer | <0.5% | <0.5% | |
| Base | Wave 1 n=53,731 |
Wave 2 n=39,568 |
|---|---|---|
| Education | ||
| Some elementary | <0.5% | <0.5% |
| Completed elementary | <0.5% | <0.5% |
| Some high school | 2% | 2% |
| Completed high school | 8% | 8% |
| Some community college/vocational/trade school/CEGEP | 11% | 10% |
| Completed community college/vocational/trade school/CEGEP | 18% | 18% |
| Some university | 10% | 9% |
| Completed university | 29% | 30% |
| Post-graduate university/professional school | 20% | 21% |
| Other | <0.5% | <0.5% |
| Don't know | <0.5% | <0.5% |
| Prefer not to answer | 1% | 1% |
| Level of functional disability | ||
| No disability | 61% | 60% |
| Mild disability | 20% | 20% |
| Moderate disability | 10% | 10% |
| Severe disability | 7% | 7% |
| Very severe disability | 2% | 2% |
| Age | ||
| 18 to 24 | 10% | 8% |
| 25 to 34 | 16% | 16% |
| 35 to 44 | 16% | 15% |
| 45 to 54 | 16% | 15% |
| 55 to 64 | 18% | 19% |
| 65+ | 24% | 27% |
| Youth | ||
| Youth 18 to 34 attending school | 7% | 6% |
| Youth 18 to 34 working full-time and not attending school | 8% | 9% |
| NEET youth | 2% | 2% |
| All other youth | 9% | 7% |
| New Canadians | ||
| Immigrants who became citizensbefore the 2015 GE | 13% | 13% |
| Immigrants who became citizensafter the 2015 GE | 2% | 2% |
| Non-immigrants | 85% | 86% |
Footnotes
Return to footnote 3 The election writs were issued August 15, 2021. This fell on a Sunday; therefore, the first day of surveying was August 16, 2021.
Return to footnote 4 Survey phases tended to change one or two days after the start of a new advertising phase to allow time for the ads to be seen before measuring recall. The early election phase of the survey does not correspond to any particular phase of the voter information campaign but instead refers to the one-week period immediately following the issuing of the election writs on August 15, 2021.
Return to footnote 5 The post-election results for 2021 and 2019 are not comparable due to a change in the question formulation.
Return to footnote 6 See "Communicating with Electors" in Elections Canada's Report on the 44th General Election of September 20, 2021.
Return to footnote 7 A third stream for ads from the safety campaign was planned but removed shortly before the start of the election period due to the uncertain environment of the COVID-19 pandemic. Specific ads from the safety campaign were therefore tested only in the post-election qualitative research. See Part 2: Qualitative Findings for an evaluation of the dedicated safety campaign. That said, general messages related to COVID-19 health and safety were included in the presented ads across all campaign streams and phases.