 Site Menu
Interest of Canadians in Internet Voting (2004, 2006, 2008 and 2011) – Research Note
Candidates' Opinions Concerning Principle of Internet Voting
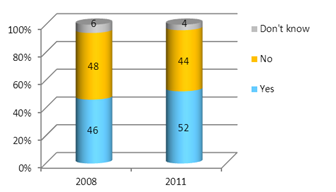
Following the 2008 and 2011 general elections, Elections Canada surveyed candidates on various issues, including Internet voting.Footnote 17 In both surveys, we asked candidates whether or not they agreed with the principle of Internet voting. On that point, Graph 14 shows a slight increase between 2008 and 2011 in respondents agreeing with the principle of Internet voting, from 46% to 52%.
Graph 14: Candidates' Opinions Concerning Principle of Internet Voting (2008 and 2011)
(% of respondents agreeing with the principle that Canadians should be able to vote over the Internet)
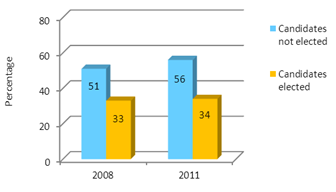
As seen in Graph 15, the percentages conceal a considerable discrepancy between the opinions of those candidates who were elected and the opinions of those who were not, both in 2008 and in 2011. More specifically, candidates who were elected expressed much less agreement with the principle of Internet voting (between 33% and 34%) than those who were not elected (between 51% and 56%). Additionally, we note that the discrepancy in the opinions of elected and unelected candidates increased by four percentage points between 2008 and 2011, widening the opinion gap from 18 to 22 percentage points.
Confirming these observations, the association between whether or not one is elected and one's opinion concerning the principle of Internet voting is statistically significant. Furthermore, we note that the association is negative and that it increased in strength between 2008 and 2011. In other words, all things being equal otherwise, a candidate who was elected is significantly less likely to agree with the principle of Internet voting than a candidate who was not elected.
Graph 15: Opinions of Elected and Unelected Candidates on the Principle of Internet VotingFootnote 18 (2008 and 2011)
(% of respondents agreeing with the principle of Internet voting)
| 2008 (EC) | 2011 (CES) |
|---|---|
| Χ2 = 7.71 (p < 0.001) γ = – 0.35 |
Χ2 = 18.63 (p < 0.001) γ = – 0.43 |
Return to source of Footnote 17 877 out of 1,601 candidates in 2008 and 1,008 out of 1,587 candidates in 2011 took part in the survey.
Return to source of Footnote 18 The "Not sure" category was excluded from the analysis.