 Site Menu
Survey of Electors following the June 18, 2018, Federal By–election in Chicoutimi–Le Fjord
Detailed Findings
I. Awareness of the By–election and Voter Information
Widespread awareness of June 18, 2018, federal by–election
The vast majority of respondents (93%) said they were aware that a federal by–election took place on June 18, 2018, in their riding of Chicoutimi–Le Fjord, Quebec.
Figure 1: Awareness of By–election
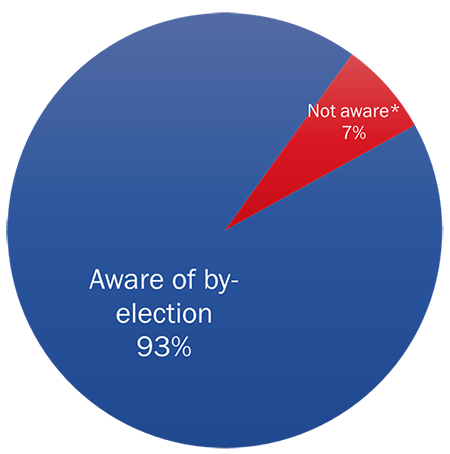
Q1: Did you know that a federal by–election took place on June 18, 2018, in your riding? Base: n=400; all respondents
*Includes those respondents–1%–who said "don't know".
Awareness of the federal by–election was higher among:
- University graduates (98%) compared to those with high school or less education (89%);
- Electors from two–person households (96%) compared to single–person households (89%); and
- Those aged 25 and older compared to electors aged 18–24 (93% of 25– to
34–year–olds, 97% of 35– to 54–year–olds, and 95% of electors aged 55 and older versus 76% of electors aged 18–24).
Moderate recall of EC advertising
Six in ten (61%) of those who were aware of the federal by–election recalled seeing, hearing or reading advertisements or communications from EC about where and when to vote for the June 18, 2018, federal by–election.
Figure 2: Recall of Elections Canada Advertisements
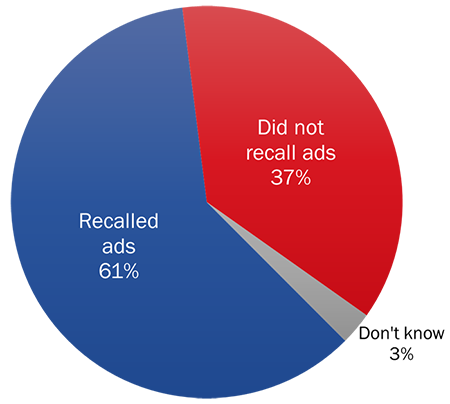
Q29. During the election period, did you see, hear or read any advertising or communications from Elections Canada about how, when and where to vote in the by–election on June 18? Base: n=373; those aware of the by–election.
*Percentages may not add to 100% due to rounding.
Recall of advertising or communications was higher among the following:
- Respondents aged 55 and older (65%) compared to those aged 25–34 (47%);
- Those who are retired (69%) compared to those who are employed (56%);
- Those who voted in the federal by–election (69%) compared to those who did not (52%); and
- Those who received their voter information card (66%) compared to those who did not (34%).
EC materials and traditional media were main sources of recall
Those who recalled seeing, hearing or reading advertising or communications from EC for the June 18, 2018, federal by–election were most likely to have mentioned the EC householder (31%), radio (26%) and newspapers (21%) as the source. Following this, 17% of respondents noticed communications from EC from their voter information card.
Figure 3: Source of Recall of Elections Canada Advertising
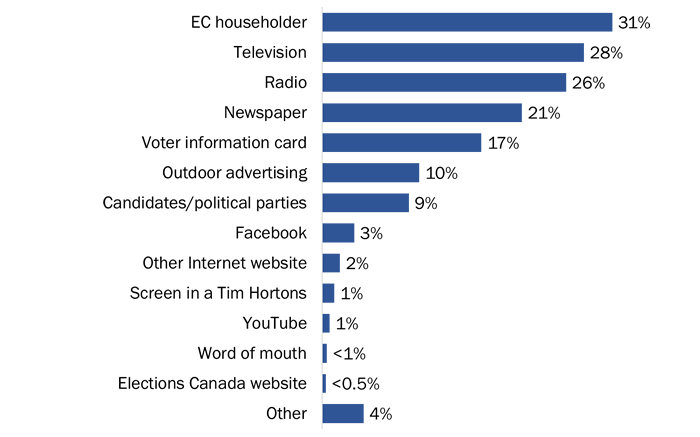
Q29a: Where did you see, hear or read about it? Base: n=224; respondents who recalled communications from EC [Dk/nr: 1%]. (Multiple responses accepted). Note: 28% of respondents mentioned television ads, but EC did not run any television ads in this by–election.
Notable subgroup differences include the following:
- Women (38%) were more likely than men (24%) to say they recalled advertisements or communication about the federal by–election via the EC householder.
- Those aged between 35 and 54 (38%) were more likely to recall hearing advertisements or communications on the radio than electors aged 55 and older (20%).
- Those aged 35 and older were more likely than those aged 25 to 34 to have read about the federal by–election in a newspaper (22% of those aged 35 to 54 and 26% of those aged 55 and older versus 4% of those aged 25 to 34).
- Those with some post–secondary education (39%) were more likely than university graduates (20%) to mention the EC householder as the source of their awareness.
- Electors who are university graduates were more likely to recall advertisements or communications through a newspaper (35%) and radio (31%) than those with high school or less education (15% mentioned a newspaper and 17% the radio).
While 28% of respondents recalled seeing EC ads on television, there were no such ads during this specific federal by–election. This could be due to several factors, including confusion with other electoral communications, such as partisan advertising or news reports about the federal by–election.
Vast majority felt informed about how, when and where to vote
Nearly nine in 10 (87%) respondents aware of the federal by–election felt informed about how, when and where to vote for the June 18, 2018, federal by–election, with 73% saying they felt very informed.
Figure 4: Knowledge of How, When and Where to Vote

Q28. Overall, how well informed do you feel you were about how, when and where to vote? Base: n=373; those aware of the by–election [Dk/nr: 1%]
*Percentages may not add to 100% due to rounding.
Respondents in the following subgroups were more likely to feel informed:
- Electors aged 55 and older (95%) compared to those aged 35 to 54 (85%), aged 25 to 34 (75%) and aged 18 to 24 (57%);
- Those living in a single–person household (91%) versus those living in a household of three or more people (81%);
- Those who voted in the federal by–election (99%) and those who received their VIC (97%) versus those who did not vote (74%) and did not receive their VIC (32%); and
- Those who have a high level of trust in the election outcome (88%) versus those who have a low level of trust (70%).
Few used EC's website, but those who did were satisfied with the information
Six percent of electors who were aware of the federal by–election visited EC's website during the campaign. Respondents who voted in the federal by–election were more likely to visit EC's website (10%), compared to those who did not (2%).
Of the 23 respondents who visited EC's website, 84% were satisfied with the information provided on the website, with half saying they were very satisfied. Two respondents (8%) were not satisfied with the information on the website.
Figure 5: Elections Canada Website

Q30 [left]. Did you visit Elections Canada's website during the campaign? Base: n=373; those aware of the by–election [Dk/nr: <0.5%]
Q31 [right]. Overall, how satisfied were you with the information on Elections Canada's website? Would you say...? Base: n=23; all who visited the site [Dk/nr: 8%]
Few contacted EC, but those who did were satisfied with the information
Two percent of electors who were aware of the federal by–election said they contacted EC during the campaign. Furthermore, all electors who contacted EC were satisfied with the information they received, with 88% saying they were very satisfied.
II. Voter Information Card and Registration
Most received a voter information card
Most electors (83%) who were aware of the federal by–election said they received their voter information card.
Figure 6: Receipt of Voter Information Card
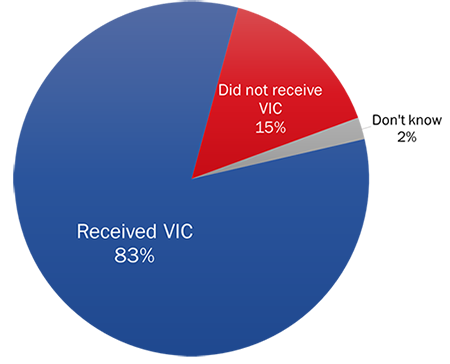
Q4. During the campaign, did you receive a voter information card addressed to you personally and telling you where and when to vote? Base: n=373; those who said they were aware of the by–election
The likelihood of saying they received a VIC was higher among:
- Respondents aged 55 and older (93%) compared to respondents aged 18 to 24 (63%), 25 to 34 (67%) and 35 to 54 (79%);
- Electors who voted in the federal by–election (96%) compared to those who did not (70%);
- Those who have a high level of trust in the election outcome (86%) compared to those who do not (60%); and
- Those who felt the election was run fairly (87%) compared to those who did not know whether the election was run fairly (62%).
More than nine in 10 electors who received a VIC reported it had the correct name (94%) and address (96%). Electors who are retired were more likely to report that the name (98%) and address (99%) on their VIC were correct, compared to respondents who were employed, among whom 90% had a correct name, and 95% had a correct address.
Majority brought their VIC to vote
Nearly three–quarters (73%) of electors who voted at an EC office, advance poll, or polling station on election day said they brought their VIC with them.
Figure 7: Voter Information Card – Brought to Vote
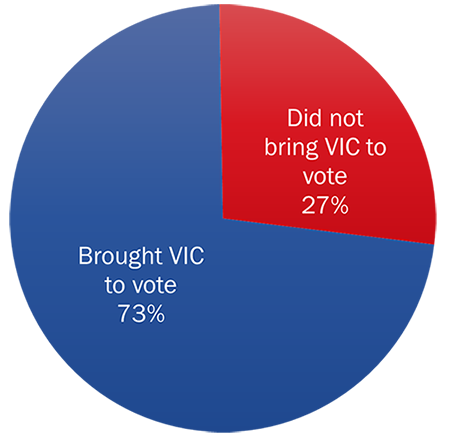
Q21. Did you bring your voter information card with you to the polling station/advance polling station/local Elections Canada office? Base: n=186; respondents who voted
The likelihood of bringing their VIC to vote was higher among:
- Those aged 55 and older (78%) compared to those aged 35 to 54 (59%);
- Those who live in a single–person household (81%) than those who live in a household of three or more people (63%);
- Those who voted at an advance polling station (84%) than those who voted at a polling station on election day (70%); and
- Those who felt that EC ran the federal by–election fairly (73%) than those who did not (23%).
Most electors who did not receive a VIC did nothing to find out if registered
Most (86%) electors who did not receive a VIC during the campaign did nothing to find out whether they were registered to vote in the federal by–election. Those who did something to find out if they were registered did so at the polling station or the local EC office (3%), consulted the EC website (3%), or called the 1–800 EC phone number (2%). The remaining 10% relied on other methods to find out if they were registered to vote.
Figure 8: Steps Taken to Find out if Registered to Vote

Q7: What did you do to find out whether you were registered to vote in this by–election? Base: n=65; respondents who did not receive a VIC.
*Percentages may not add to 100% due to rounding.
Almost all electors know they need to be registered in order to vote
Ninety–two percent of electors knew that they need to be registered in order to vote in a Canadian federal election.
Figure 9: Awareness of Registration to Vote

Q8. To the best of your knowledge, do electors need to be registered on the list of electors to vote in a Canadian federal election? Base: n=400; all respondents
The likelihood of knowing that electors need to be registered on the list of electors to vote in a Canadian federal election was higher among:
- Electors aged 25 to 34 (98%), 35 to 54 (94%) and 55 and older (94%) compared to electors aged 18 to 24 (67%).
- University graduates (95%) than those who have some post–secondary education (88%);
- Those who were aware of the June 18, 2018, federal by–election (94%) compared to those who were not aware of the federal by–election (74%); and
- Electors who have a low level of trust (100%) in the results compared to those who have a high level of trust (94%).
Among electors aged 18 to 24, a third gave incorrect answers: 11% thought electors did not need to be registered in order to vote, while 22% said they did not know.
Almost half aware they can register at the polling station and vote immediately
Nearly half (48%) of electors surveyed were aware that electors can register at the polling place and then vote immediately after.
Figure 10: Election Day Registration

Q9AB. Electors must be registered to vote in a federal election. If an elector is not registered on election day and wants to vote, can they register at the polling place and then vote immediately after? Base: n=400; All respondents.
Notable subgroup differences include the following:
- Older respondents, aged 55 and older, were more likely to answer that they did not know (25%) compared to respondents aged 25 to 34 (13%); and
- Electors who voted at an advance poll were more likely to correctly answer yes (72%) compared to those who voted at a regular polling station on election day (47%).
Of note is the absence of any difference according to education, occupation, household size and other common predictors of knowledge about electoral issues.
Most Canadians aware of Online Voter Registration Services
A split sample was used to test awareness of online registration for the third time.footnote 1 Half the respondents (n=200) were asked if electors could use an "Online Voter Registration Service on EC's website", a question previously used in post–electoral phone surveys. As this question has always yielded a high proportion of "don't know" answers, a simplified formulation was developed and asked to the other half of the sample (see full questions under the graph, below).
In both samples, most electors were aware of online registration (63% and 83%, respectively). However, the second formulation led to a higher proportion of respondents who said "yes", and a lower proportion of respondents who said they "do not know."
Figure 11: Awareness of Online Voter Registration

Q10A. To the best of your knowledge, could electors use an Online Voter Registration Service on Elections Canada's website to check, update or complete their voter registration during the last by–election?
Q10B. To the best of your knowledge, is it possible for Canadian electors to check, update or complete their voter registration on Elections Canada's website?
*Base: n=200 for each question; split sample.
**Percentages may not add to 100% due to rounding.
The results of this third split sample test confirm that the second formulation of the question is easier to understand, as it resulted in a smaller proportion of respondents who indicated they did not know.
Regardless of question formulation, respondents aged 55 and older were more likely to say they did not know the answer to this question (33% for combined questions, 43% for the standard question and 21% for the simplified wording) compared to respondents aged 25 to 34 (14% did not know, combined questions) and aged 35 to 54 (13% did not know, combined questions).
III. Voting and Voter Participation
Half of electors reported voting in the federal by–election
Exactly half of electors who were aware of the federal by–election said they voted in the June 18, 2018, federal by–election.
Figure 12: Voter Participation in June 18, 2018, By–election

Q2: Which of the following statements describes you? Base: n=373; those who said they were aware of the by–election.
*Percentages may not add to 100% due to rounding.
Significant subgroup differences include:
- Electors aged 55 and older (64%) were more likely to vote than electors aged 18 to 24 (32%), 25 to 34 (36%) and 35 to 54 (39%).
- Respondents living in a single–person (56%) or two–person (58%) household were more likely to vote than those living in a household with three or more people (39%).
- Those who received their VIC were more likely to vote (59%) compared to those who did not (12%).
- The likelihood of voting was higher among those who had a high level of trust in the accuracy of the results (53%, compared to 27% of those who do not) and those who felt the federal by–election was run fairly (57%, compared to 16% of those who did not know if it was run fairly).
- The likelihood of voting was higher among those who voted in the 2015 federal election (57%), compared to those who were unsure if they voted in 2015 federal election (25%).
Everyday life and health are main reasons for not voting in the election
Of the 183 respondents who said they did not vote during the June 18, 2018, federal by–election, 45% said they did not vote due to everyday life and health reasons. Following closely, 39% reported they did not vote due to political reasons. Very few (5%) did not vote due to electoral process–related reasons.
Figure 13: Main Reasons for Not Voting – Themes

Q3: What is the main reason you did not vote? Base: n=183; respondents who did not vote [Dk/nr: 2%]
The likelihood of not voting due to everyday life or health reasons was higher among:
- Those who have a high level of trust in the election outcome (48%) compared to those who have a low level of trust (18%); and
- Those who voted in the 2015 federal general election (48%) compared to those who did not (28%).
The likelihood of not voting due to political reasons was higher among:
- Those who have a low level of trust in the election outcome (67%) compared to those who have a high level of trust (36%); and
- Those who did not vote in the 2015 federal general election (56%) compared to those who did (35%).
Of note, younger non–voters were more likely to say they were too busy to vote compared to those aged 55 and older: 44% of respondents aged 18 to 24 said they were too busy, a proportion that decreased for those aged 25 to 34 (35%), 35 to 54 (29%) and 55 and older (14%). Further, men were twice as likely to say they were out of town (22%) than women (10%).
The table below provides a breakdown of all the reasons why respondents did not vote during the June 18, 2018, federal by–election.
Figure 14: Main Reasons for Not Voting – Breakdown
| Reasons for Not Voting | % |
|---|---|
| Everyday life or health reasons | 45% |
| Too busy | 26% |
| Out of town | 16% |
| Illness or disability | 3% |
| Political reasons | 39% |
| Not interested in politics | 18% |
| Did not like candidates/parties/campaign | 10% |
| Lack of information about campaign issues and parties' positions | 6% |
| Felt voting would not make a difference | 4% |
| Did not know who to vote for | 2% |
| Electoral process–related reasons | 5% |
| Transportation problem/polling station too far | 2% |
| Issues with the voter information card | 1% |
| Not on voters list | Less than 1% |
| Could not prove identity or address | Less than 1% |
| Lack of information about voting process (e.g. when/where to vote) | Less than 0.5% |
| Other reasons | 9% |
| Forgot to vote | 2% |
| Other | 7% |
Of the respondents who said they were out of town (n=30) during the election, 52% said they were out of town due to personal reasons and 48% due to work. Men were more likely to be away due to work (64%), while women were more likely to be away due to personal reasons (87%).
Additionally, 71% of those who were out of town during the election had previously planned their travel. For 29% of these electors, this travel was unplanned.
Electors are aware of various voting methods
Nearly all respondents (96%) said they were aware that electors could vote at advance polling stations. Fifty–seven percent said that it is possible to vote at the local EC office, while fewer electors (21%) said electors can vote by mail.
Figure 15: Knowledge of Voting Methods
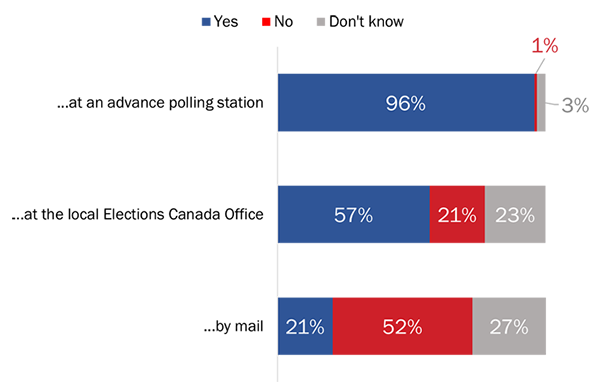
Q11A. At federal elections, is it possible for Canadian electors to vote ... at the advance polling station? Base: n=400.
Q11B. At federal elections, is it possible for Canadian electors to vote ... at the local Elections Canada office? Base: n=400.
Q11C. At federal elections, is it possible for Canadian electors to vote ... by mail? Base: n=400.
*Percentages may not add to 100% due to rounding.
Awareness of the possibility of voting at an advance polling station was higher among:
- Respondents aged 35 to 54 (98%) and 55 and older (98%), compared to those aged 18 to 24 (80%); and
- Respondents with a high level of trust in the outcome of the election (98%), compared to those who have a low level of trust (81%).
Awareness of the possibility of voting at a local EC office was higher among:
- Respondents aged 55 and older (66%), compared to those aged 18 to 24 (39%) and 35 to 54 (47%);
- Respondents living in single–person (63%) or two–person (63%) households, compared to those living in a household with three or more people (47%); and
- Respondents who received their VIC (61%) compared to those who did not (39%).
Women were more aware of the possibility of voting advance polls (99%, compared to 93% for men) and at the local EC office (63%, compared to 50% for men). However, more men (26%) than women (15%) were aware that they can vote through mail.
Majority of electors voted at polling station on election day
Three–quarters (74%) of electors reported they voted at a polling station on election day, while 24% went to an advance polling station to vote. A very small proportion of voters reported voting by mail (1%) or at a local EC office (1%).
Figure 16: Methods Used to Vote

Q12: Which method did you use to vote? Was it... Base: n=189; all respondents who voted
Electors who voted on election day were more likely to be:
- Between the ages of 35 to 54 (89%) than aged 55 and older (66%); and
- University graduates (86%) than to have high school or less education (70%) and some post–secondary education (67%).
Electors who voted at an advance polling station were more likely to:
- Be aged 55 and older (31%) than aged 35 to 54 (8%);
- Have high school or less education (27%) or some post–secondary education (33%) than to be university graduates (11%); and
- Be part of a two–person household (29%) than a household with three or more people (13%).
IV. Voter Identification
Widespread awareness of identification requirements
Using a split sample, awareness of identification requirements was tested. Traditionally, post–electoral surveys ask respondents whether or not they need a proof of identity to vote, and then the question is repeated for proof of address. In previous post–electoral surveys, this formulation led to very high proportions of "yes" for both questions; however, survey pre–tests seemed to indicate that some respondents did not perceive a difference between the two (i.e., between proof of address and proof of identity). Thus, a second version of this question was developed, asking respondents whether, to the best of their knowledge, electors need proof of identity, proof of address, both, or none. The two formulations were compared using the aforementioned split sample experiment.
Comparable to previous surveys, the first formulation found that virtually all (99%) respondents think that electors have to present proof of identity in order to vote in a Canadian election. Most respondents (85%) also said electors have to present a proof of address. Another 5% said they did not know if proof of address is required.
Of those asked the second formulation, 62% correctly responded that both proof of identity and address are required to vote in a Canadian federal election. In contrast, more than one–third answered incorrectly: 34% of respondents said only proof of identity is needed, 3% said only proof of address is needed, and 1% said neither is needed to vote.
Figure 17: Awareness of Voter Identification Requirements

Q14B [left]. Do voters have to present a proof of IDENTITY in order to vote in a Canadian federal election? SPLIT SAMPLE: n=100.
Q15 [left]. Do voters have to present a proof of ADDRESS in order to vote in a Canadian federal election? SPLIT SAMPLE: n=193.
Q14A [right]. In order to vote in a Canadian federal election, must electors provide...? SPLIT SAMPLE: n=207.
The results of this split sample test confirm those of the October 23, 2017, and December 11, 2017, federal by–election survey results. Furthermore, these results suggest that the new formulation leads to results that better reflect respondents' grasp of identification requirements.
Virtually all voters found it easy to meet the identification requirement
Ninety–nine percent of voters found it easy to meet the identification requirements, with 86% saying it was very easy.
Figure 18: Ease of Meeting Voter Identification Requirements

Q16. Overall, how easy was it to meet the identification requirements? Would you say that it was...? Base: n=186; respondents who voted at an advance poll or at a polling station on election day [DK/NR: <0.5%]
*Percentages may not add to 100% due to rounding.
V. Voter Experience
Virtually all voters found it easy to vote
Of the respondents who voted during the June 18, 2018, federal by–election, 99% claimed it was easy to vote, with 87% saying it was very easy.
Figure 19: Ease of Voting

Q13. Overall, how easy was it to vote? Would you say it was...? Base: n=189; respondents who voted and identified a voting method.
*Percentages may not add to 100% due to rounding.
Nearly all agree that facilities were suitable and had enough signs
Ninety–five percent said the building where they voted was suitable, with 82% saying it was very suitable. Furthermore, 98% said that there were enough signs inside the facility to help them find voting stations.
Figure 20: Voting Facilities [Suitability]
![Figure 20: Voting Facilities [Suitability]](res/rec/eval/byJun2018/images/image021_e.png)
Q19. Would you say that the building where you voted was...? Base: n=186; respondents who voted [Dk/nr: <1%]
Virtually all (99%) who voted in person reported that the location of the polling station was a convenient distance from home. Additionally, all those who voted said that it was not difficult to reach the voting location.
Voters were most likely to vote during the evening
The largest proportion (44%) of all voters surveyed, n=186, reported voting between 4 p.m. and 8:30 p.m.
Of the voters who voted on election day (n=140), 23% reported going to vote in the morning (from the opening of polls at 8:30 a.m. till noon), 23% said they voted in the afternoon (between noon and 4 p.m.), and 49% claimed to have voted in the evening (from 4 p.m. till closing of polls).
Figure 21: Time of Day Voted [Election Day]
![Figure 21: Time of Day Voted [Election Day]](res/rec/eval/byJun2018/images/image022_e.png)
Q22. Do you remember approximately what time it was when you went to vote? Base: n=140; respondents who voted on election day. [Dk/nr: 7%]
*Election day polls hours: 8:30 a.m. to 8:30 p.m.
**Percentages may not add to 100% due to rounding.
Six in ten of those who voted at an advance polling stationfootnote 2 (n=44) from June 8 to 11, 2018, reported going to vote in the afternoon (between noon and 4 p.m.).
Figure 22: Time of Day Voted [Advance Polling]
![Figure 22: Time of Day Voted [Advance Polling]](res/rec/eval/byJun2018/images/image023_e.png)
Q22. Do you remember approximately what time it was when you went to vote? Base: n=44; respondents who voted at an advance polling station. [Dk/nr: 14%]
*Advance polling stations were open from 12 p.m. to 8 p.m. on June 8 to 11, 2018.
**Percentages may not add to 100% due to rounding.
Majority of voters took five minutes or less to vote
Nearly three–quarters (73%) of all voters surveyed said voting took them five minutes or less.
Figure 23: Length of Time to Vote [all]
![Figure 23: Length of Time to Vote [all]](res/rec/eval/byJun2018/images/image024_e.png)
Q23. To the best of your knowledge, how long did it take you to vote at the polling station/advance polling station/local Elections Canada office? This does not include travel time. Base: n=186; respondents who voted
Among those who voted at an advance polling station or on election day, three–quarters said it took them less than five minutes to vote (75% and 74%, respectively). Virtually all (99%) voters found the time taken to vote to be reasonable.
Figure 24: Length of Time to Vote [Election Day vs. Advance Polling Station]
![Figure 24: Length of Time to Vote [Election Day vs. Advance Polling Station]](res/rec/eval/byJun2018/images/image025_e.png)
Q23. How long did it take you to vote at the polling station? This does not include travel time. Base: n=44; respondents who voted at an advance polling station.
Q23. How long did it take you to vote at the polling station? This does not include travel time. Base: n=140; respondents who voted on election day.
*Percentages may not add to 100% due to rounding.
All voters were satisfied with EC staff
All voters were satisfied with the EC staff, with 88% saying they were very satisfied.
Figure 25: Satisfaction with Elections Canada Staff

Q27. Overall, how satisfied were you with the services provided by Elections Canada staff when you voted? Would you say...? Base: n=186; respondents who voted. [Dk/nr: 0.5%]
Similarly, all voters were satisfied with the service they received in their chosen official language.
Virtually all were satisfied with their voting experience
Ninety–nine percent of voters were satisfied with their overall voting experience during the June 18, 2018, federal by–election, with 81% saying they were very satisfied.
Figure 26: Satisfaction with Overall Voting Experience

Q34. Overall, how satisfied were you with your voting experience? Would you say...? Base: n=189; all respondents who voted. [Dk/nr: 1%]
*Percentages may not add to 100% due to rounding.
VI. Fairness and Trust
Most perceive EC ran the federal by–election fairly
Four in five electors (82%) who were aware of the June 18, 2018, federal by–election said that EC ran the election fairly, with 49% saying the federal by–election ran very fairly.
Figure 27: Perceptions of Elections Canada's Fairness

Q35. Thinking about the June 18, 2018, federal by–election, would you say that Elections Canada ran the election...? Base: n=373; those aware of the by–election.
*Percentages may not add to 100% due to rounding.
The likelihood of saying the election was run fairly was higher among:
- Men (88%) than women (77%); and
- Those who voted in the federal by–election (93%) than those who did not (72%).
The likelihood of saying the election was run very fairly was higher among:
- Electors aged 55 and older (56%) than those aged 18 to 24 (28%);
- Those who voted in the 2015 federal general election (53%) than those who did not (31%); and
- Those with a high level of trust in the results (52%) than those with a low level of trust (23%).
Non–voters were more likely (25%) than voters (4%) to say they did not know whether EC ran the election fairly or not.
Nine in 10 trust the accuracy of federal by–election results
Nine in 10 (90%) respondents who were aware of the federal by–election stated they have a high level of trust in the accuracy of results in their riding.
Figure 28: Trust in Accuracy of Results

Q36. What level of trust do you have in the accuracy of the election results in your riding? Is it...? Base: n=373; those aware of the by–election.
Notable subgroup differences include the following:
- Voters (94%) were more likely to have a high level of trust than non–voters (86%).
- Respondents aged 35 to 54 (95%) were more likely to have a high level of trust in the election outcome than those aged 18 to 24 (79%) and 55 and older (89%).
- Those with some post–secondary education (94%) and university graduates (96%) were more likely to have a high level of trust in the election outcome than those with high school or less education (78%).
- Those living in a two–person household (57%) were more likely to have a very high level of trust than those living in a household with three or more people (43%).
- Electors who received their VIC (93%) were likely to have a high level of trust than those who did not (76%).
- Electors who felt the election ran fairly (93%) were more likely to have a high level of trust in the election outcome than those who did not (53%).
- Those who voted in the 2015 federal general election (92%) were more likely to have a high level of trust in the election outcome than those who did not vote (76%).
Return to source of Footnote 1 Post–election surveys following the October 23, 2017, and December 11, 2017, by–elections also included this split sample test.
Return to source of Footnote 2 Advance polling stations were open from 12 p.m. to 8 p.m. on June 8 to 11, 2018.